For content strategists, educators, and technical communicators turning complex concepts into clear visual diagrams.
AI Prompts for Infographics & Visual Data Diagrams
Access prompt formulas crafted for infographic artwork, technical flowcharts, cutaway diagrams, and data visualization posters. These styles emphasize isometric perspectives, modular component hierarchy, and clean educational clarity. Generate exploded product schematics, system architecture diagrams, and educational visual explainers.
Infographic Design Prompts
Select any style to view full prompt text and the image it produced.
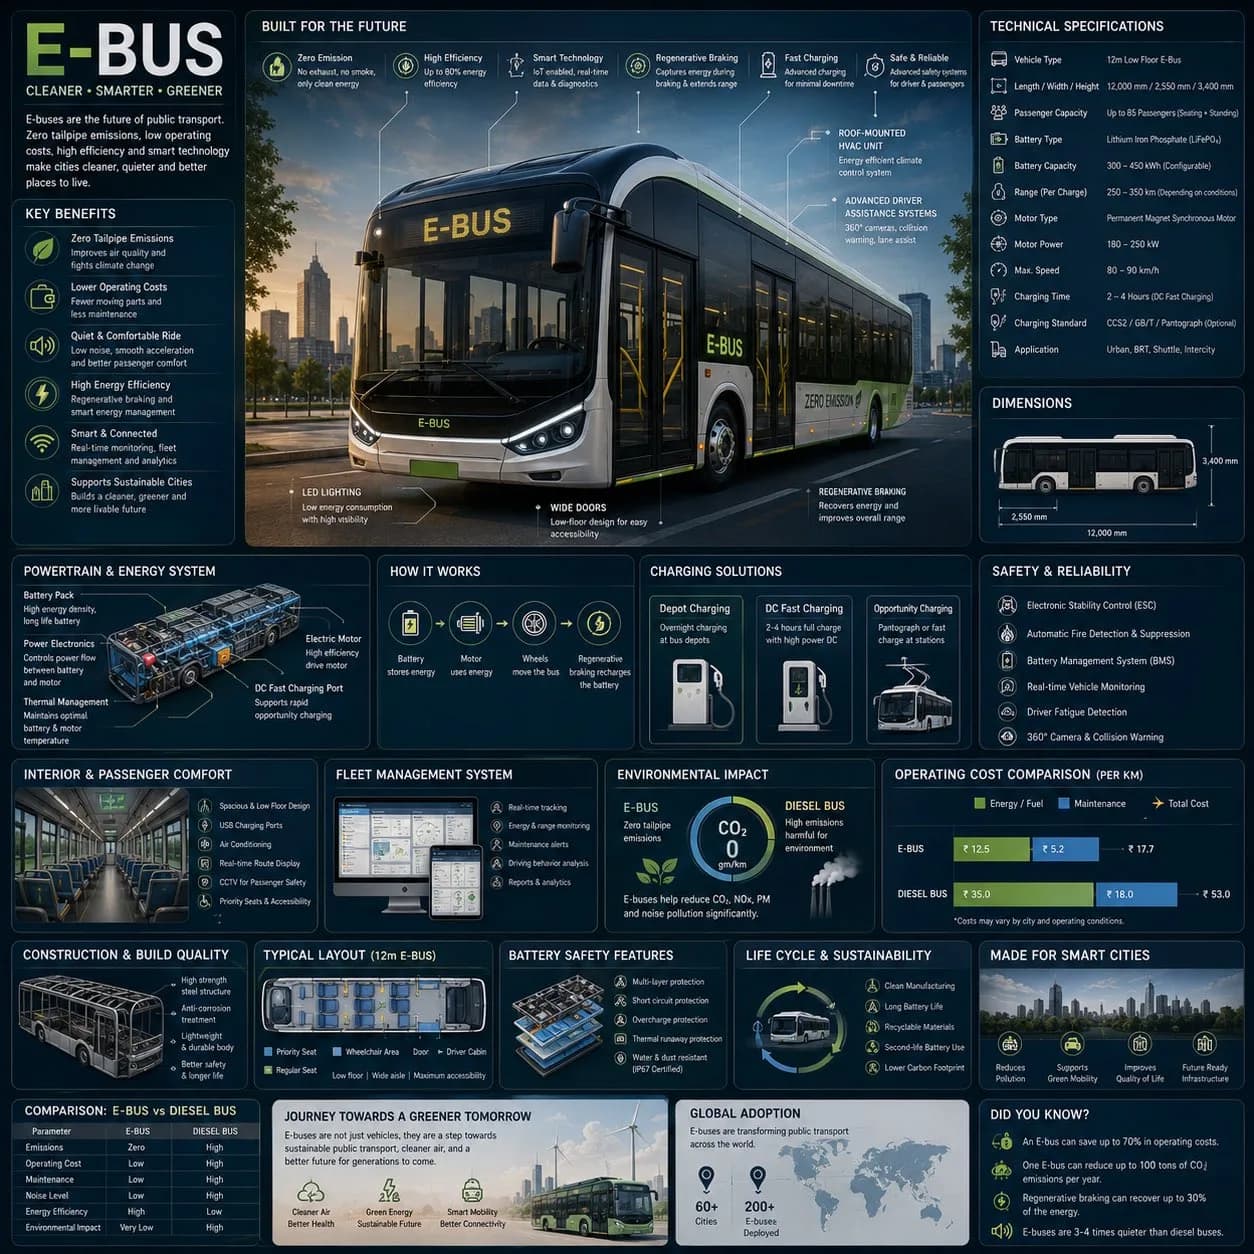
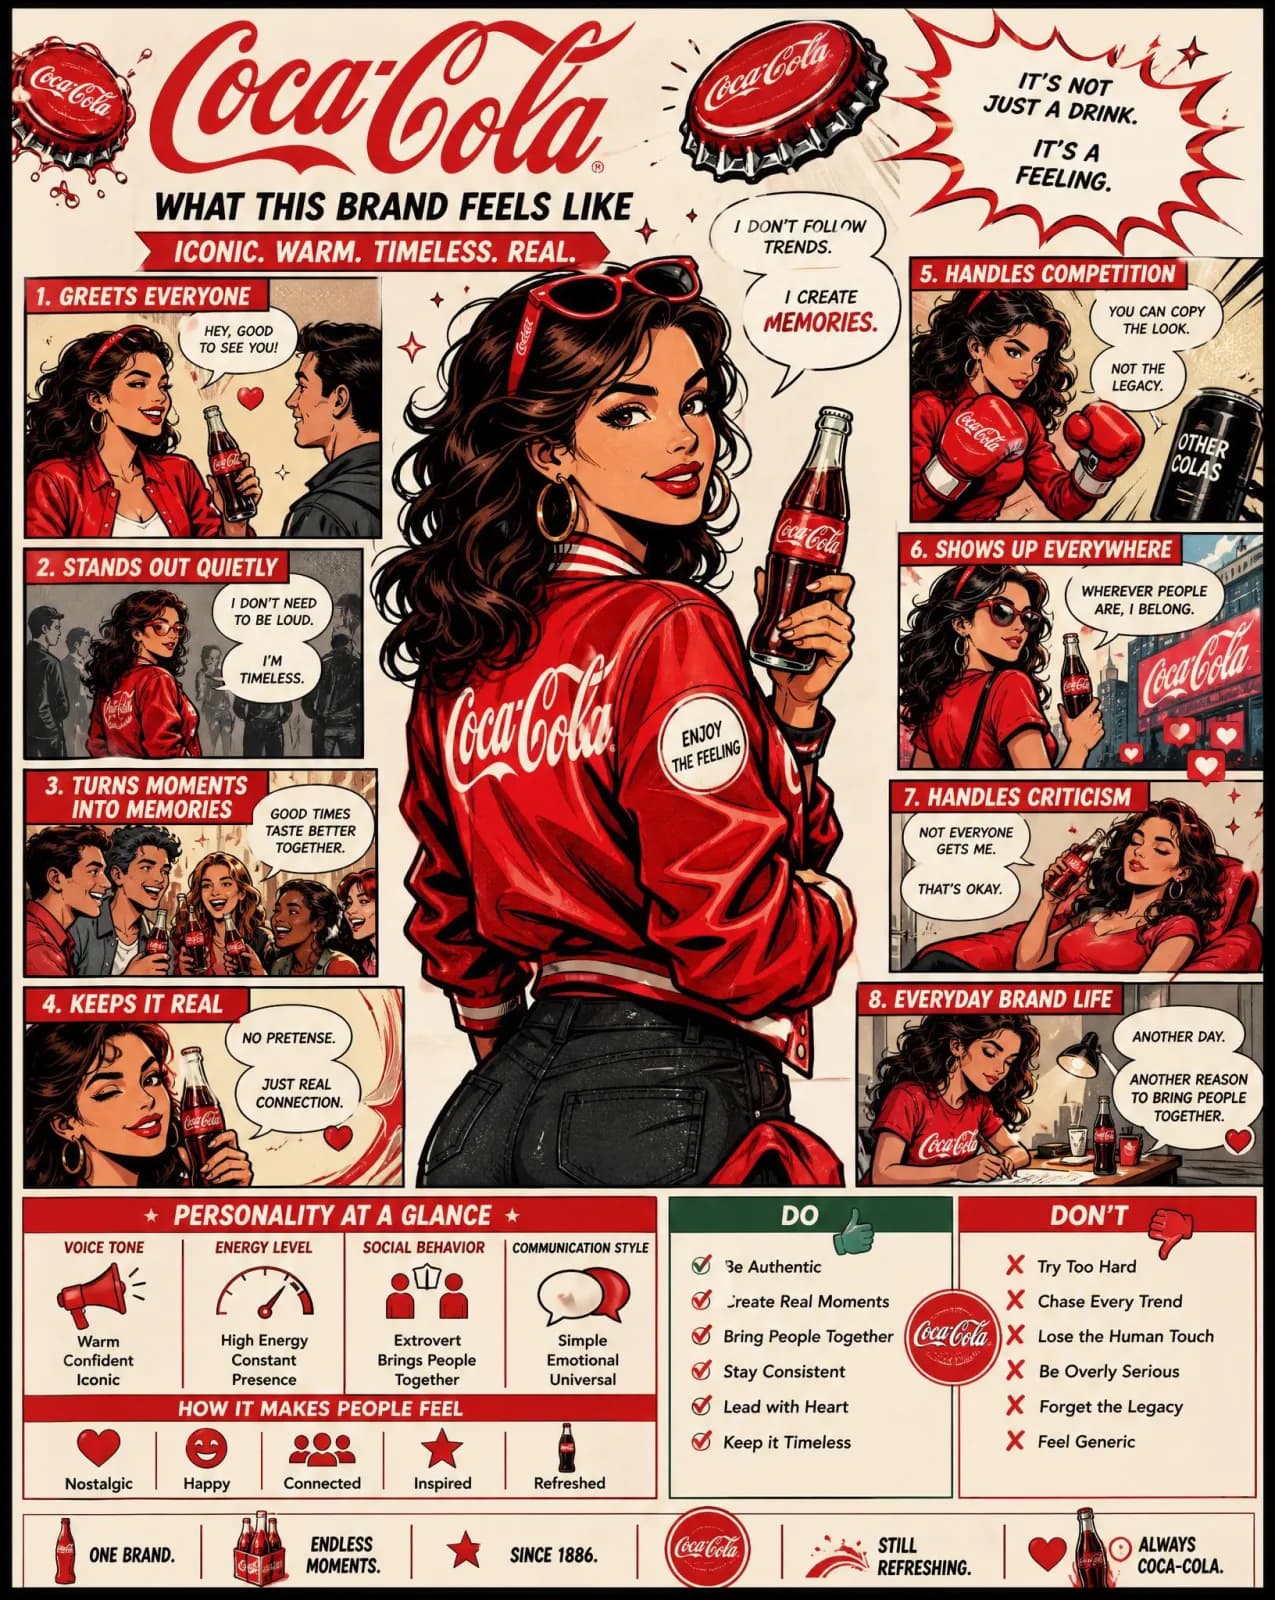
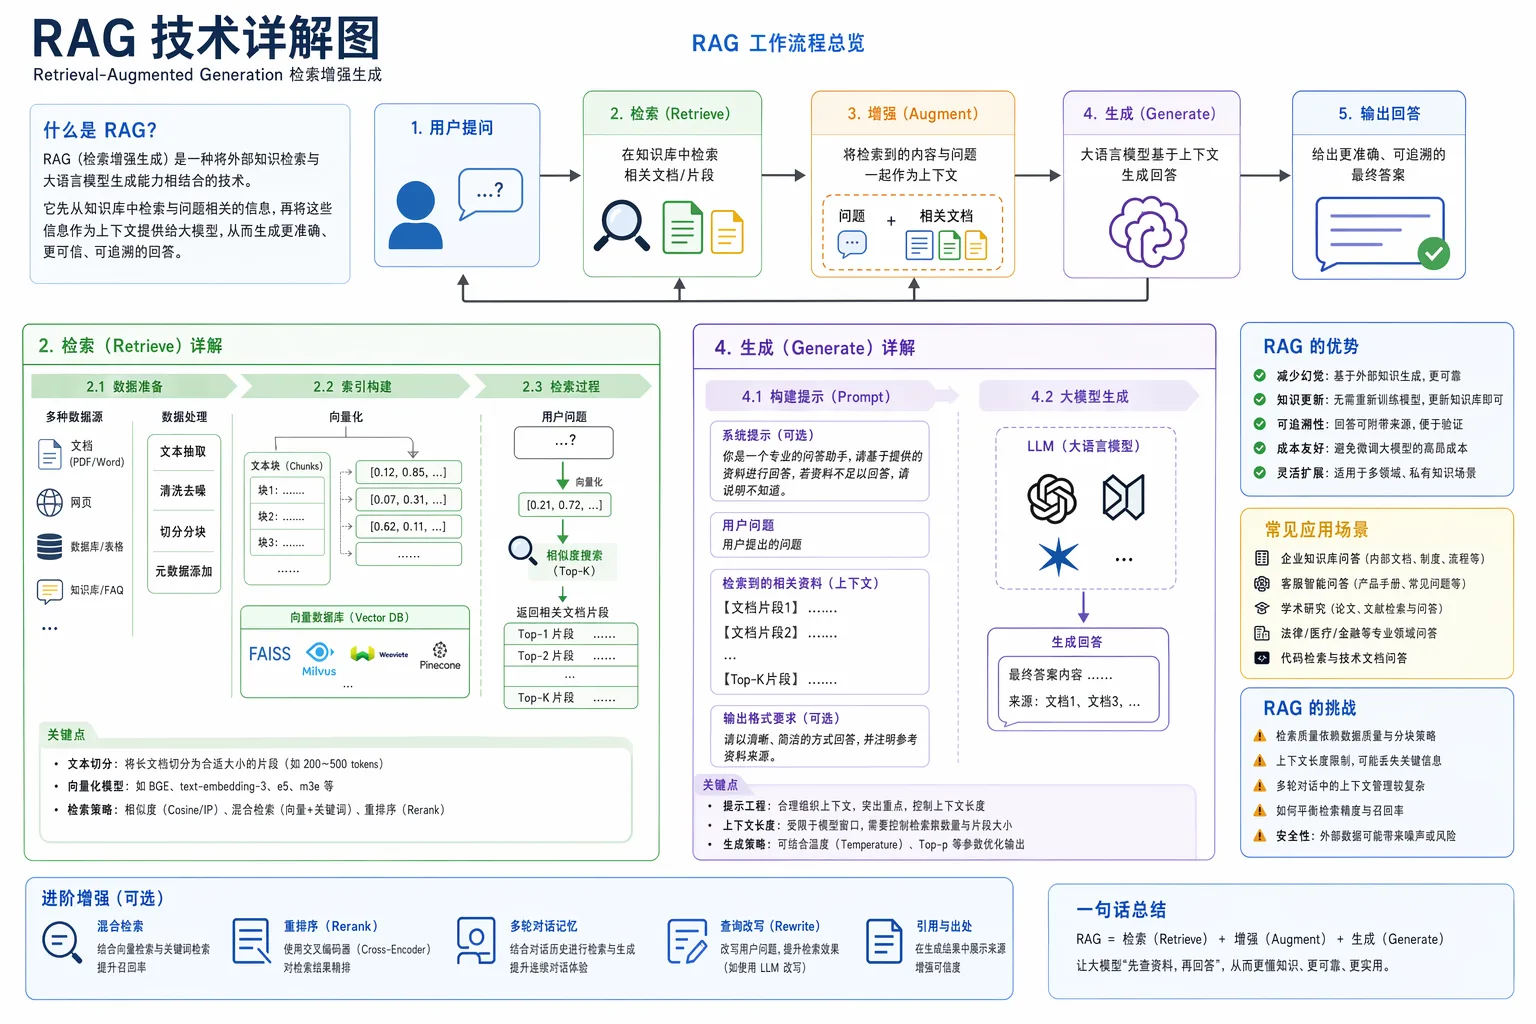
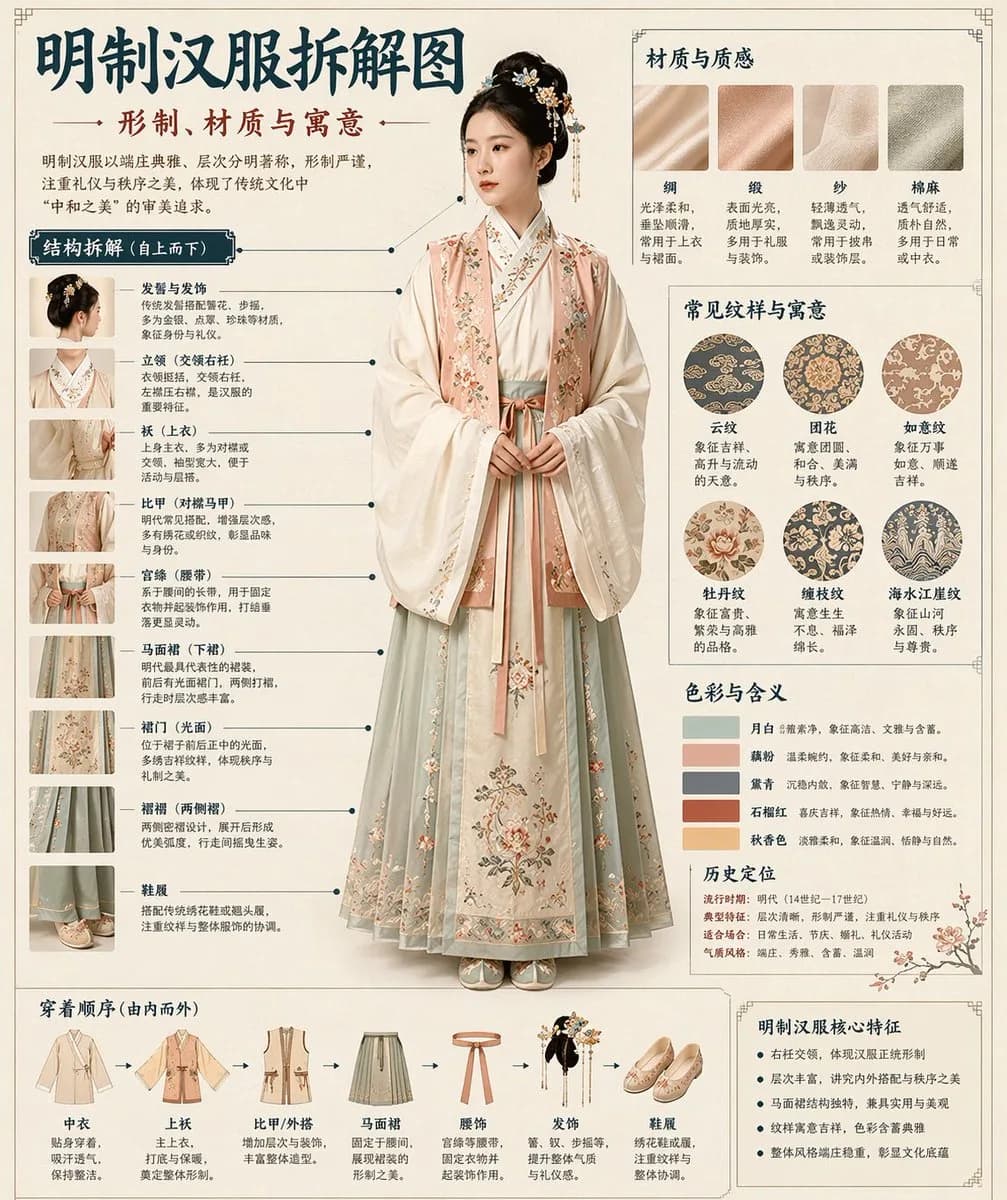
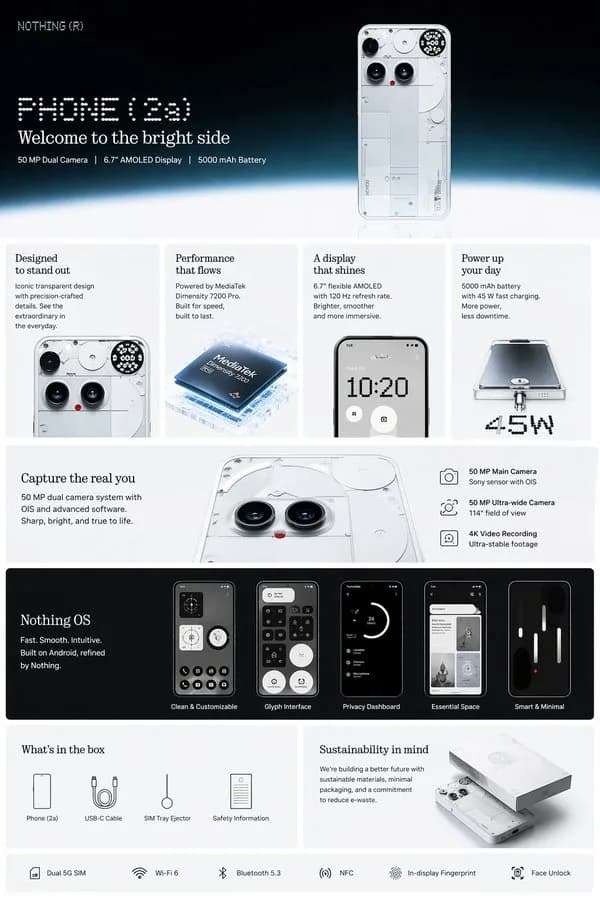
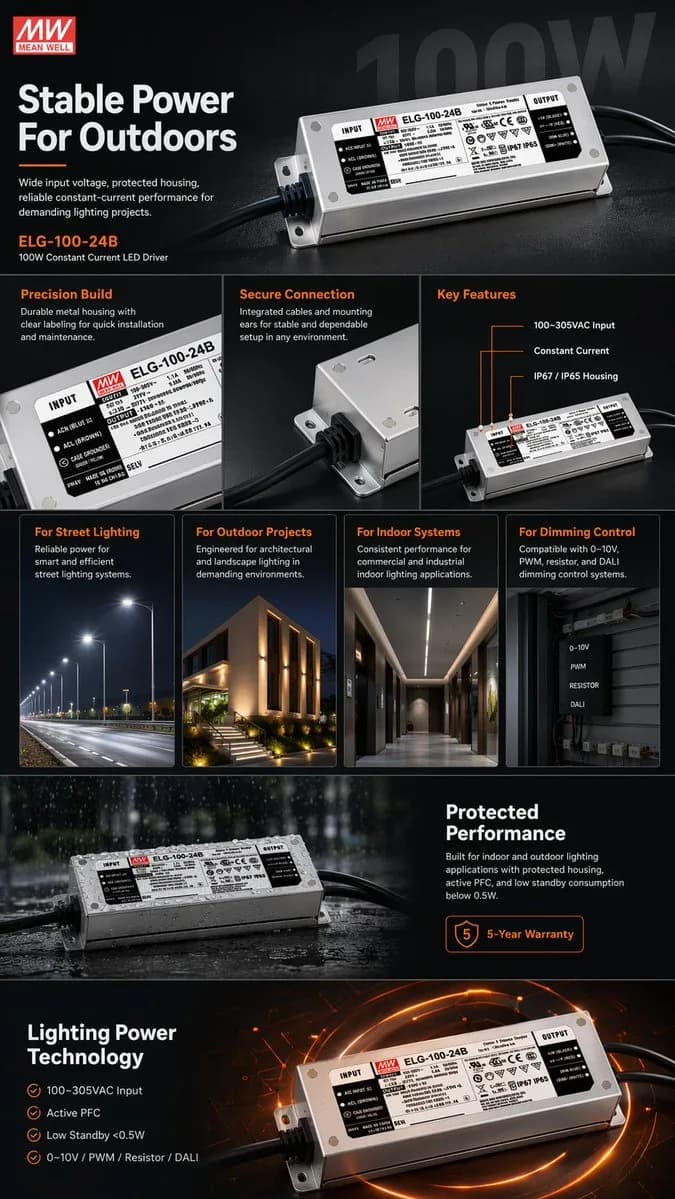
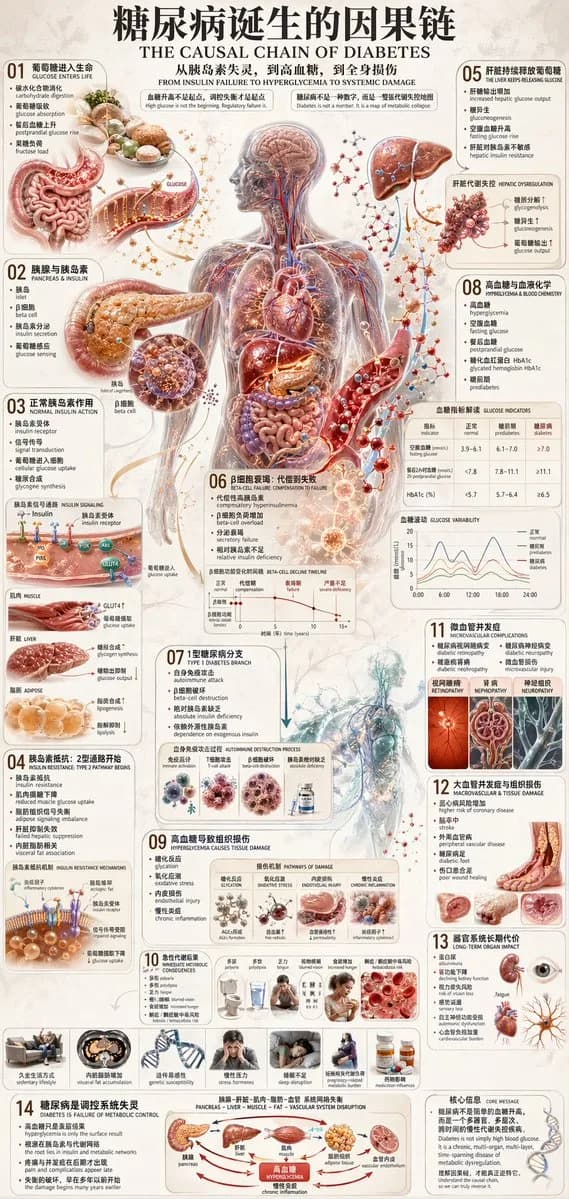

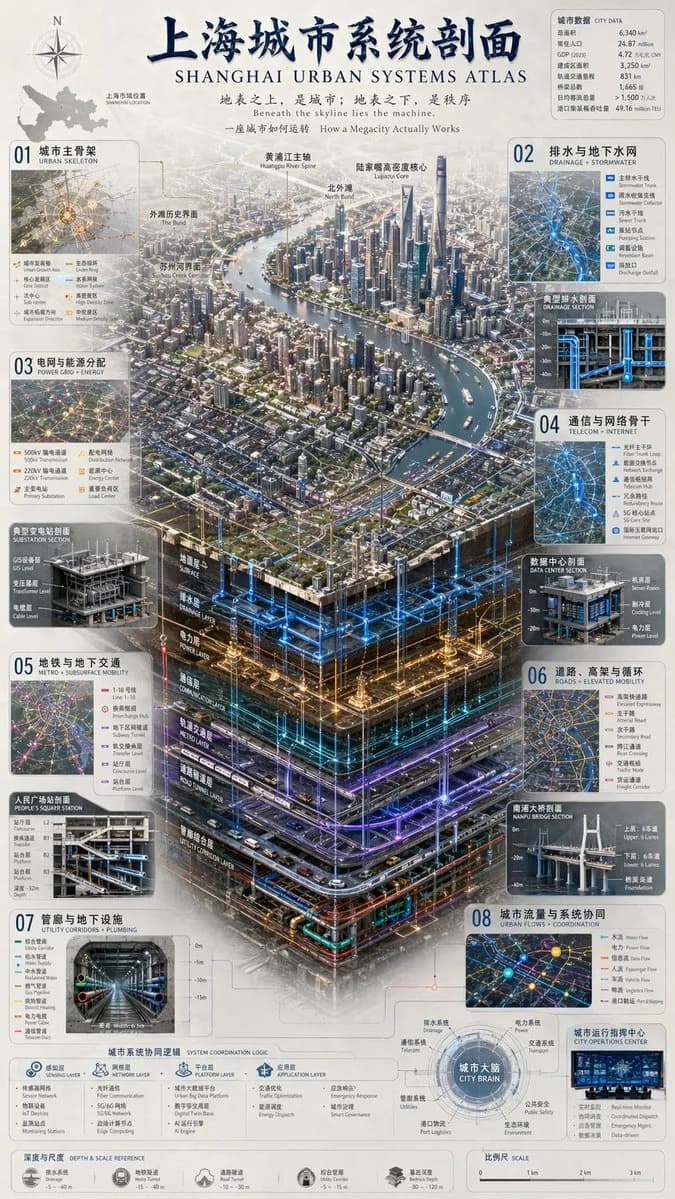
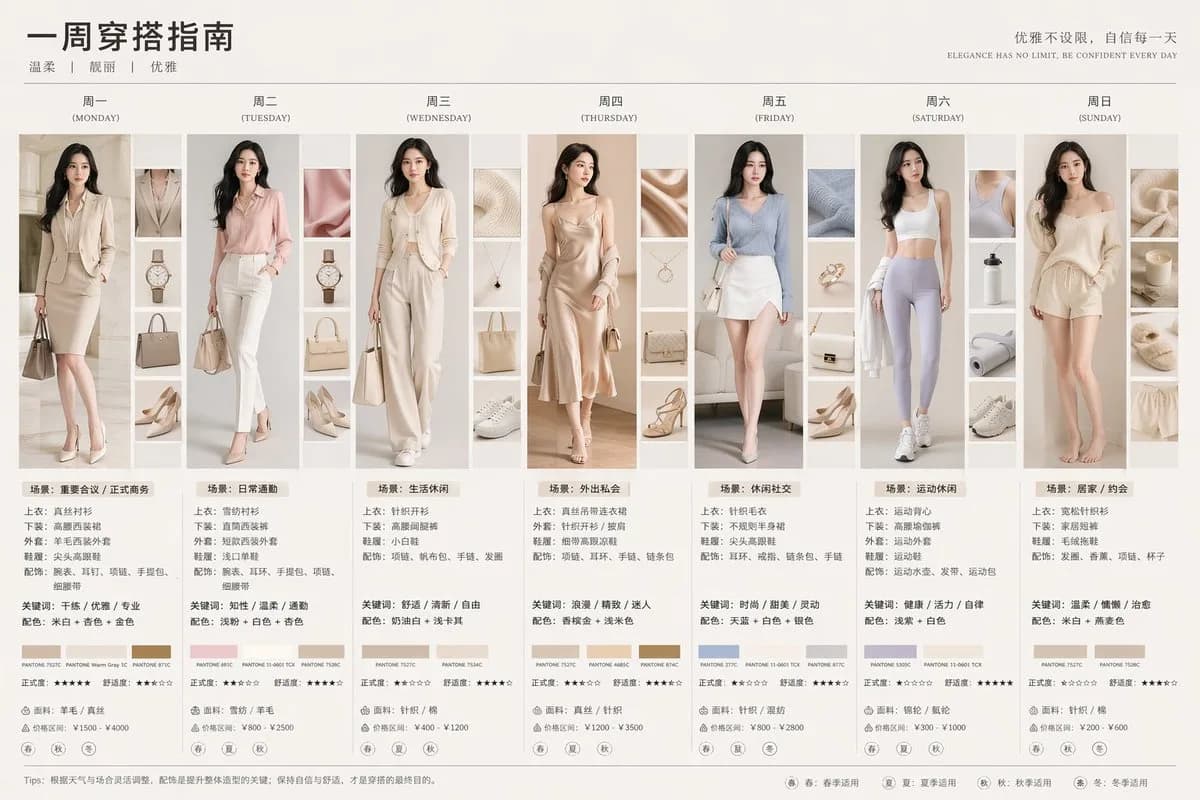
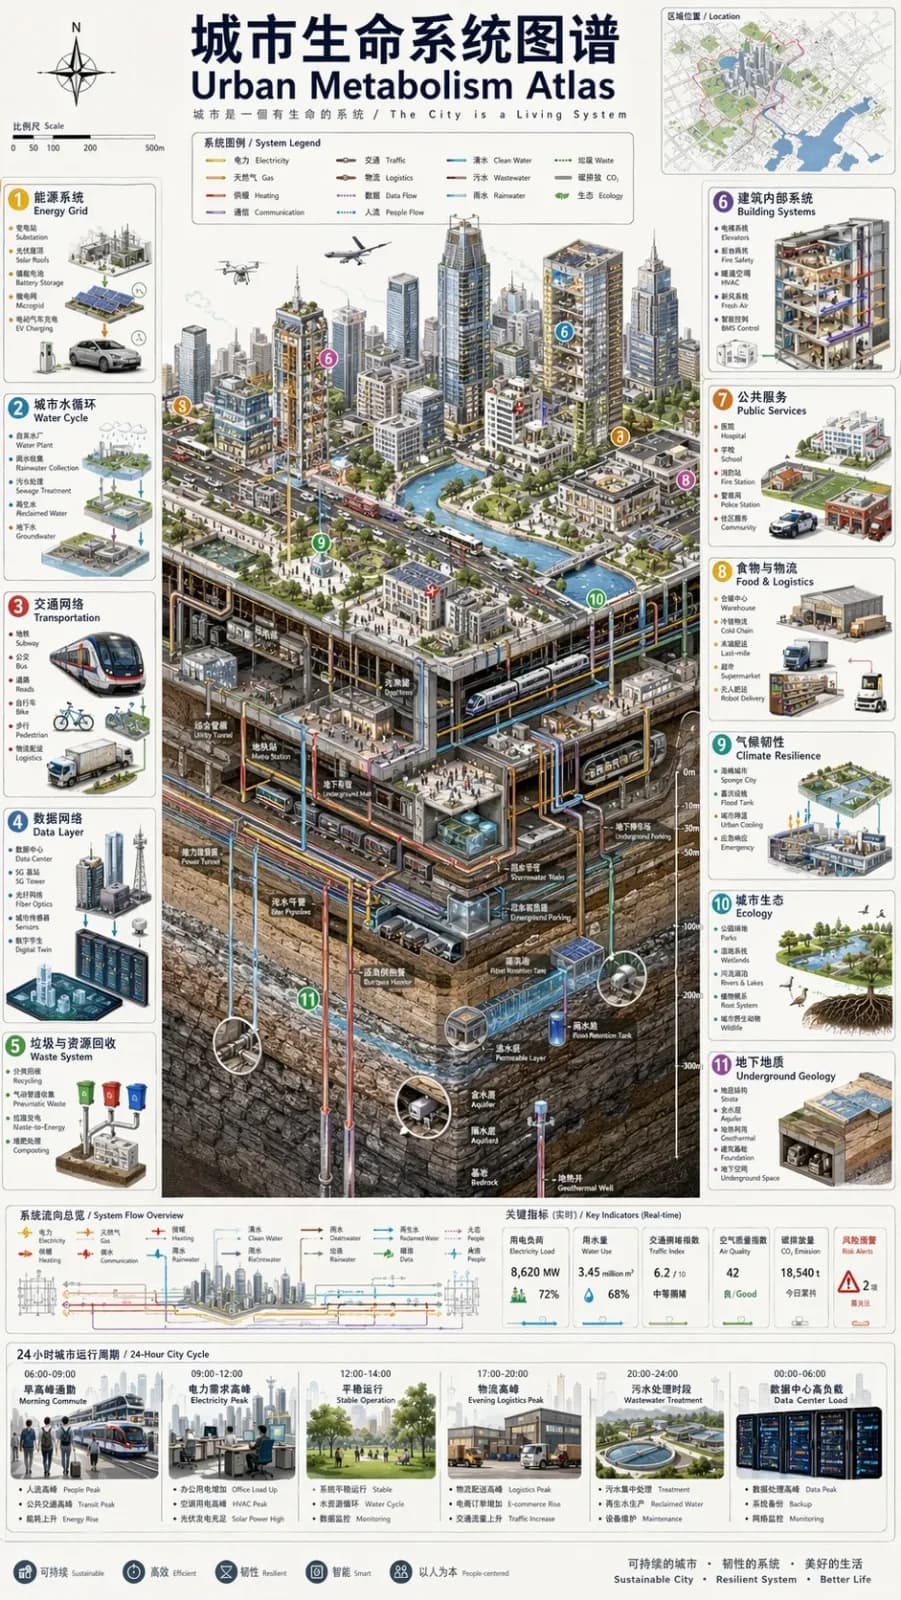
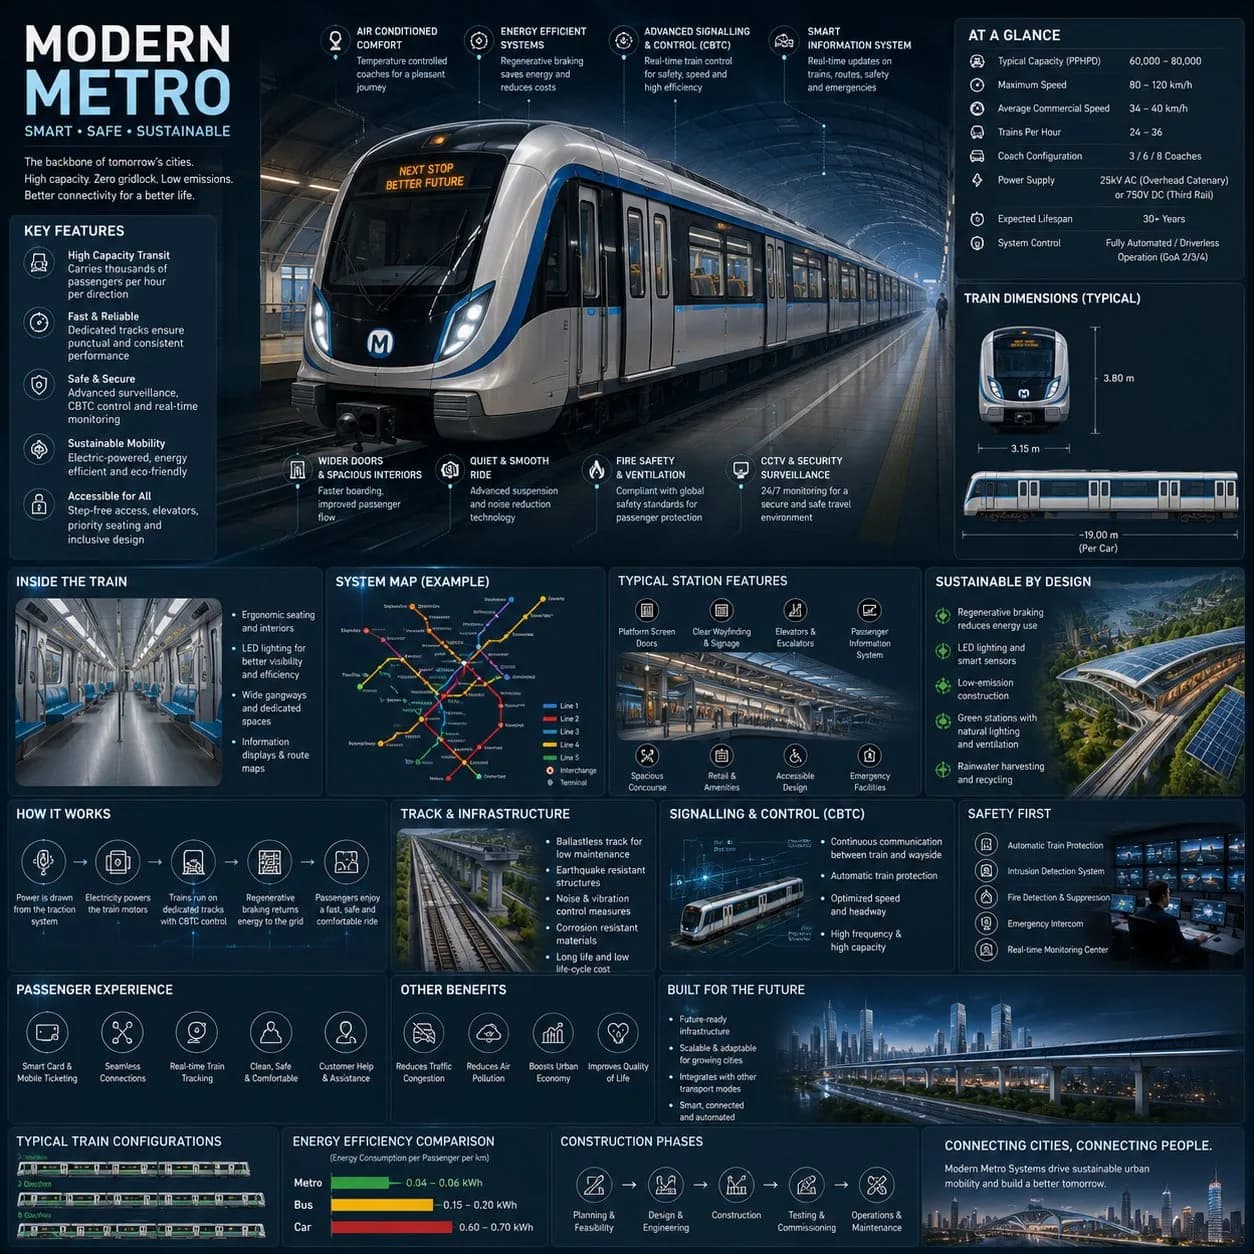
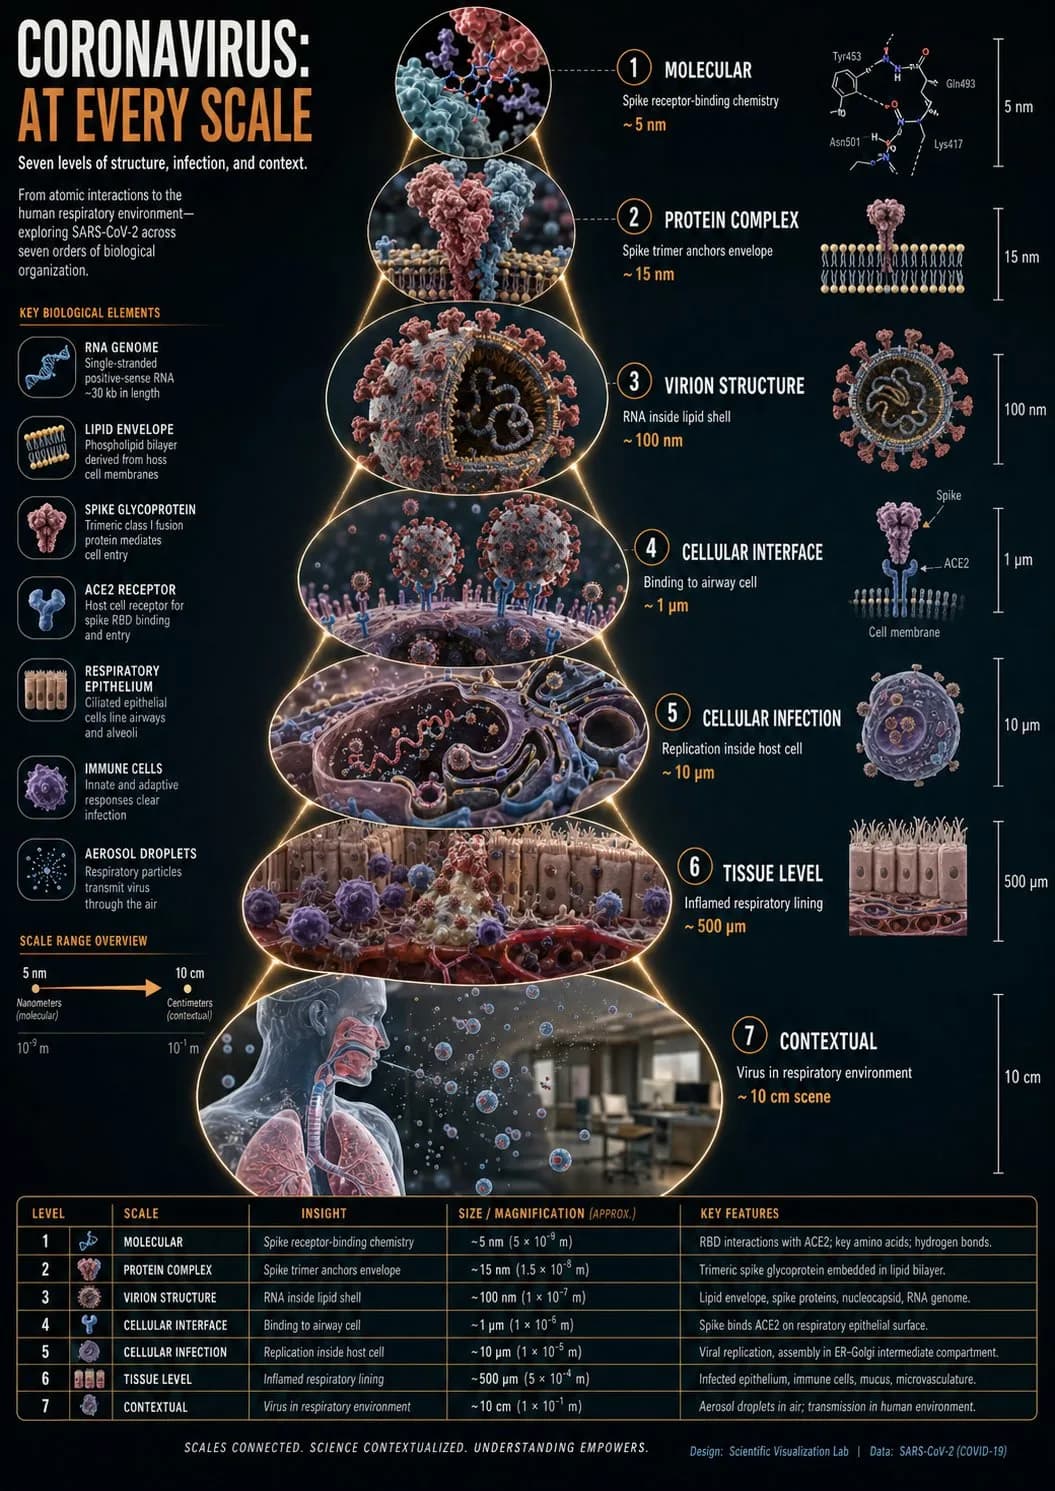
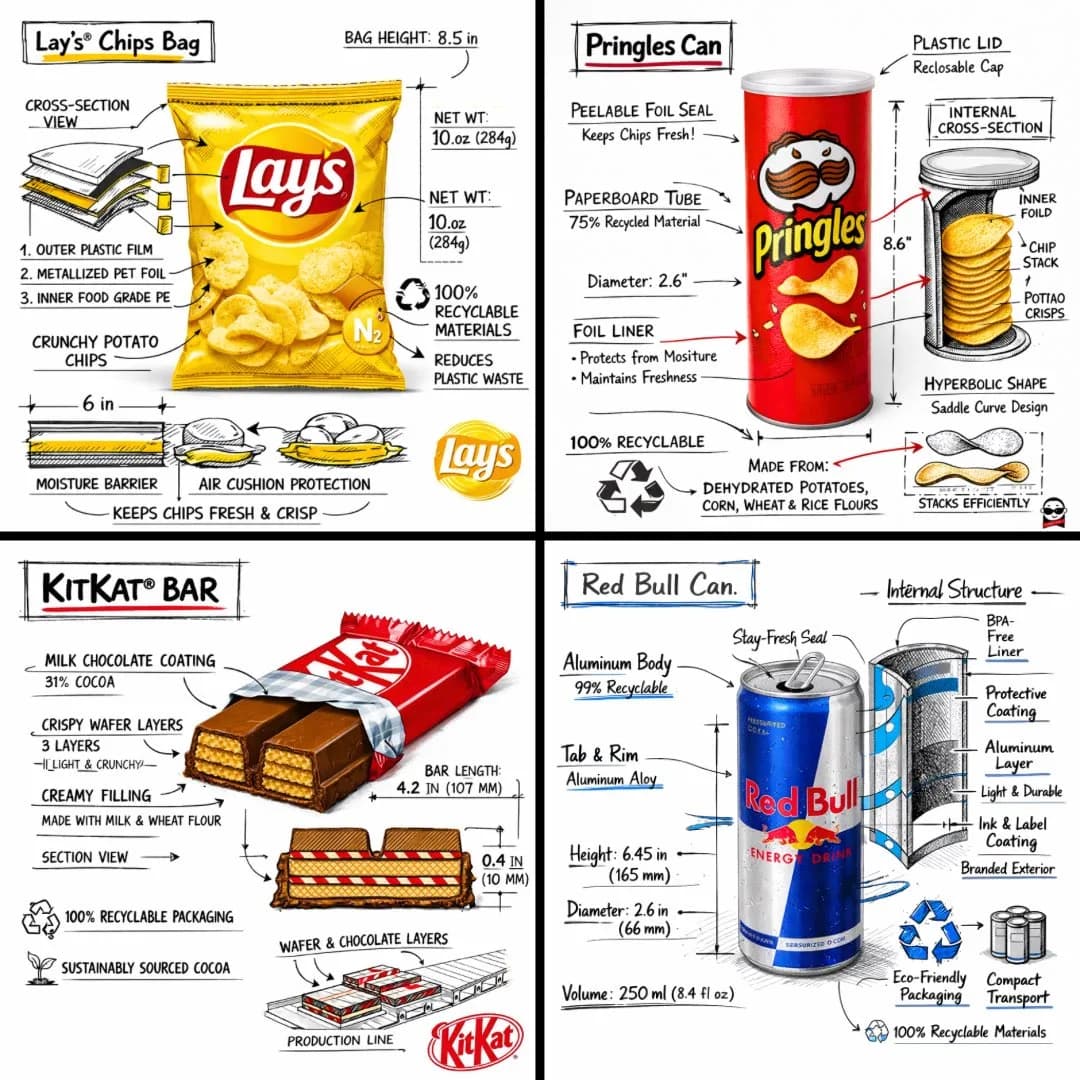
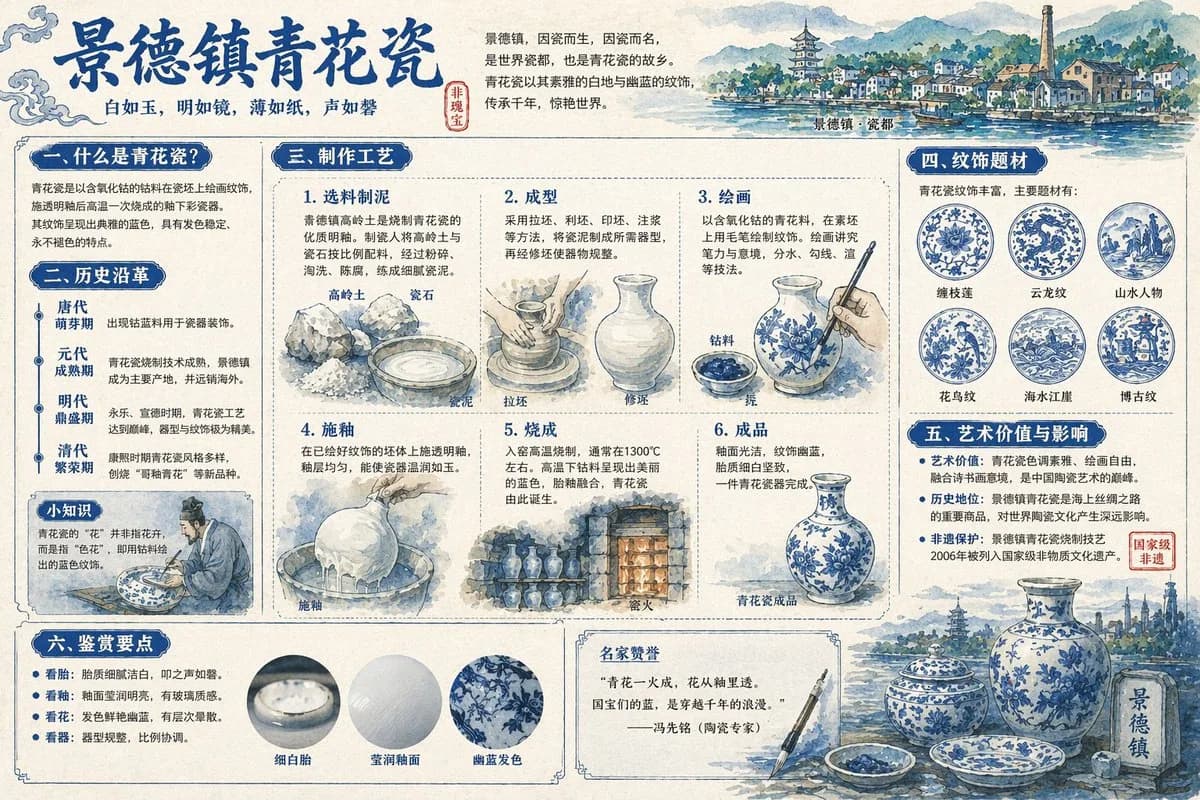
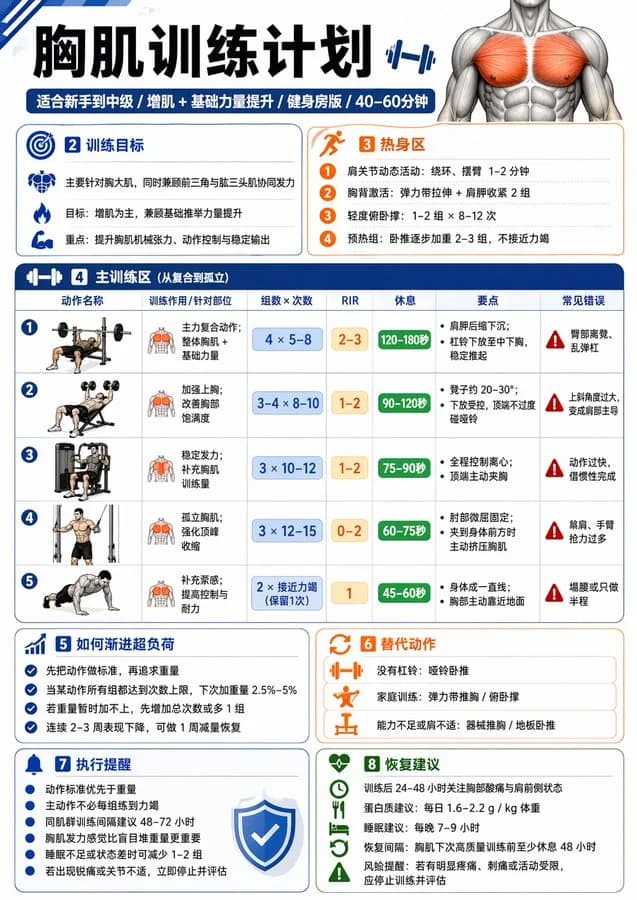
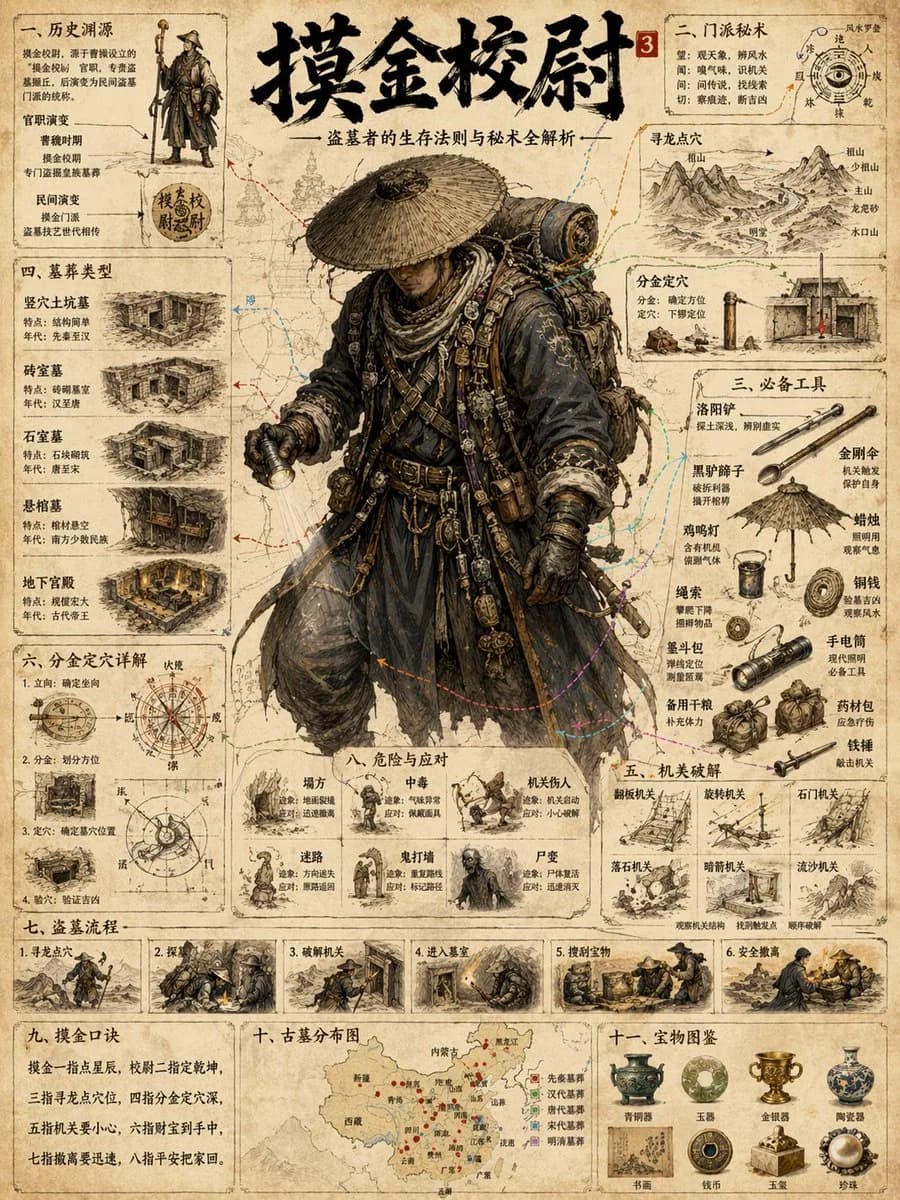

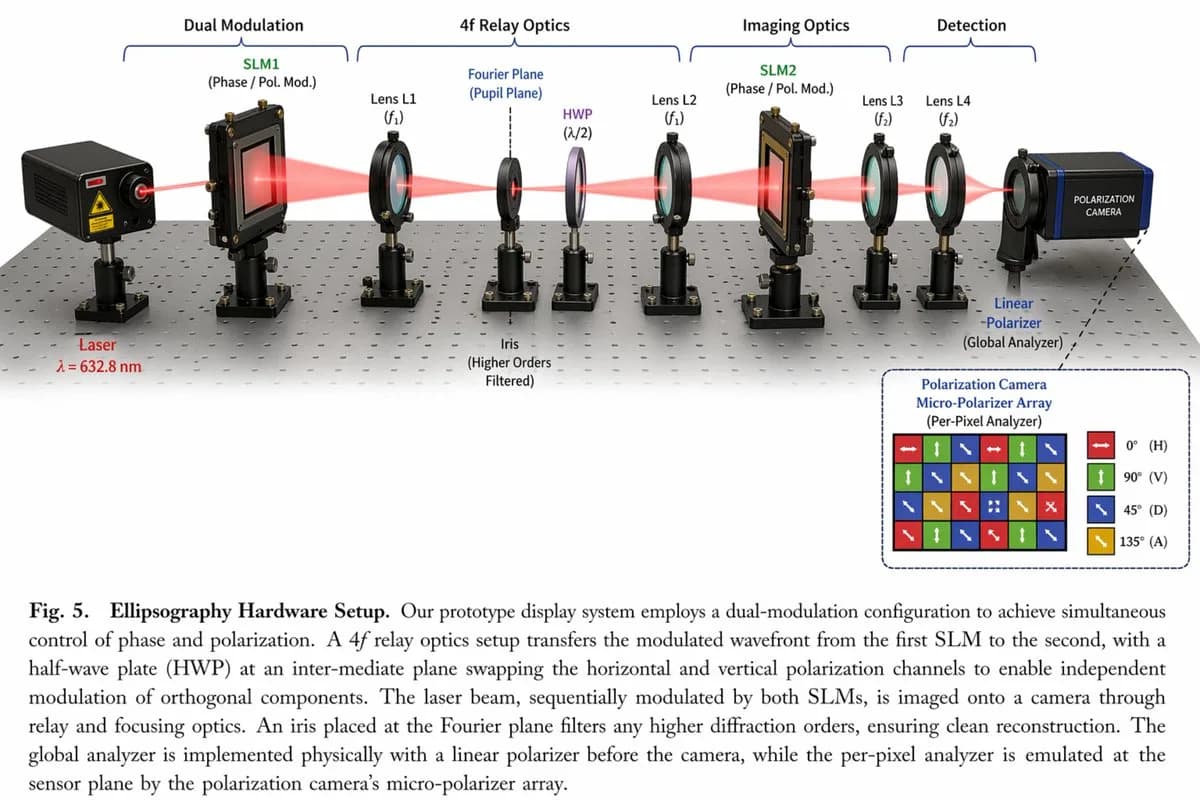
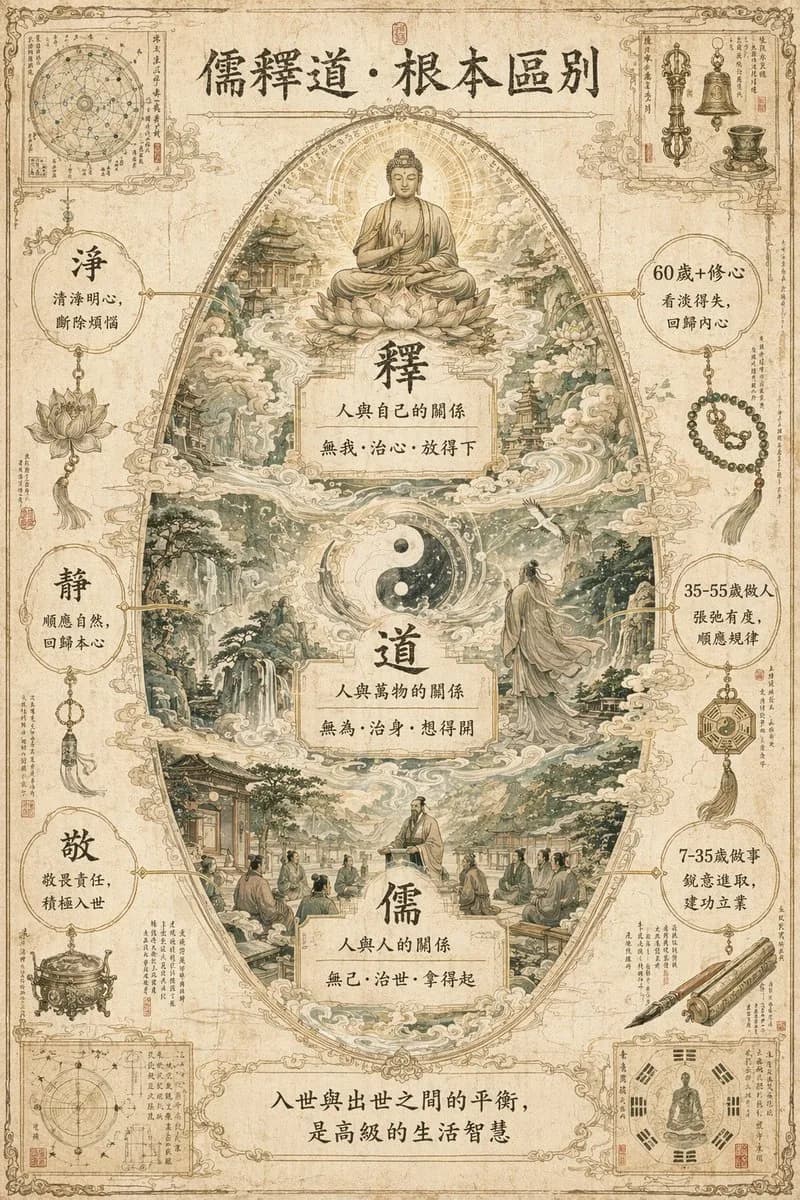
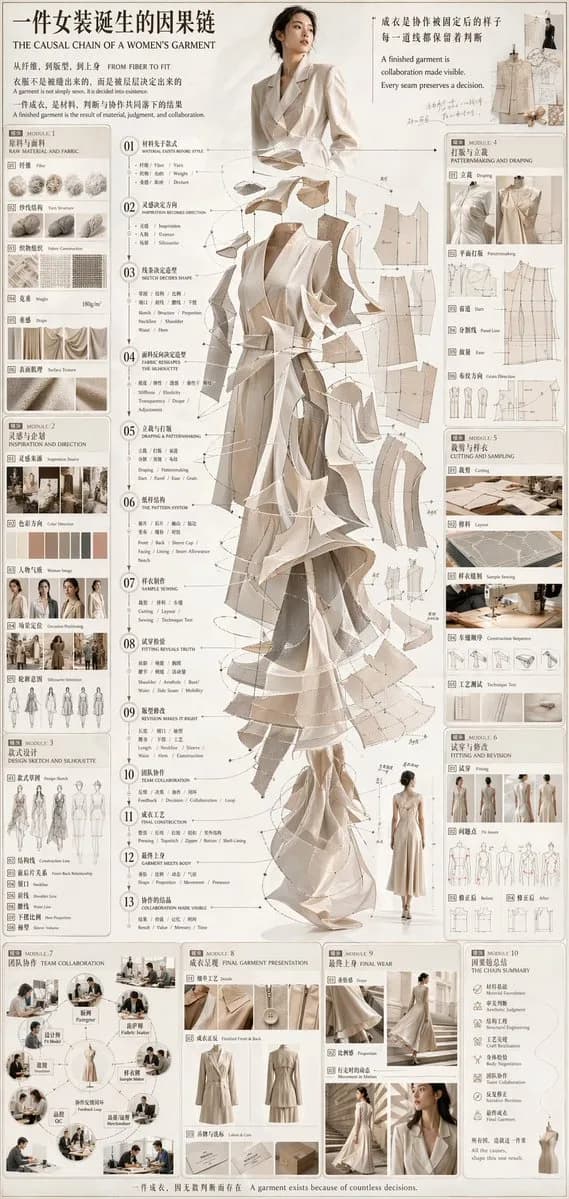
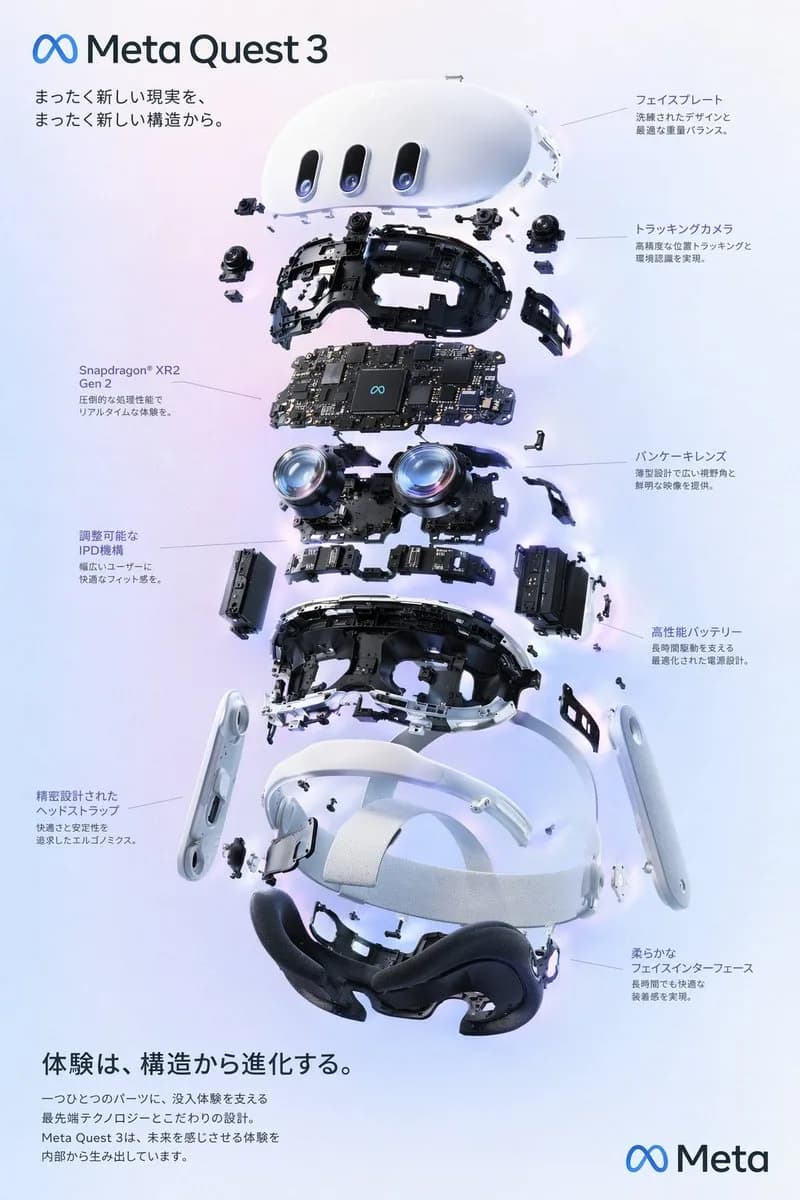
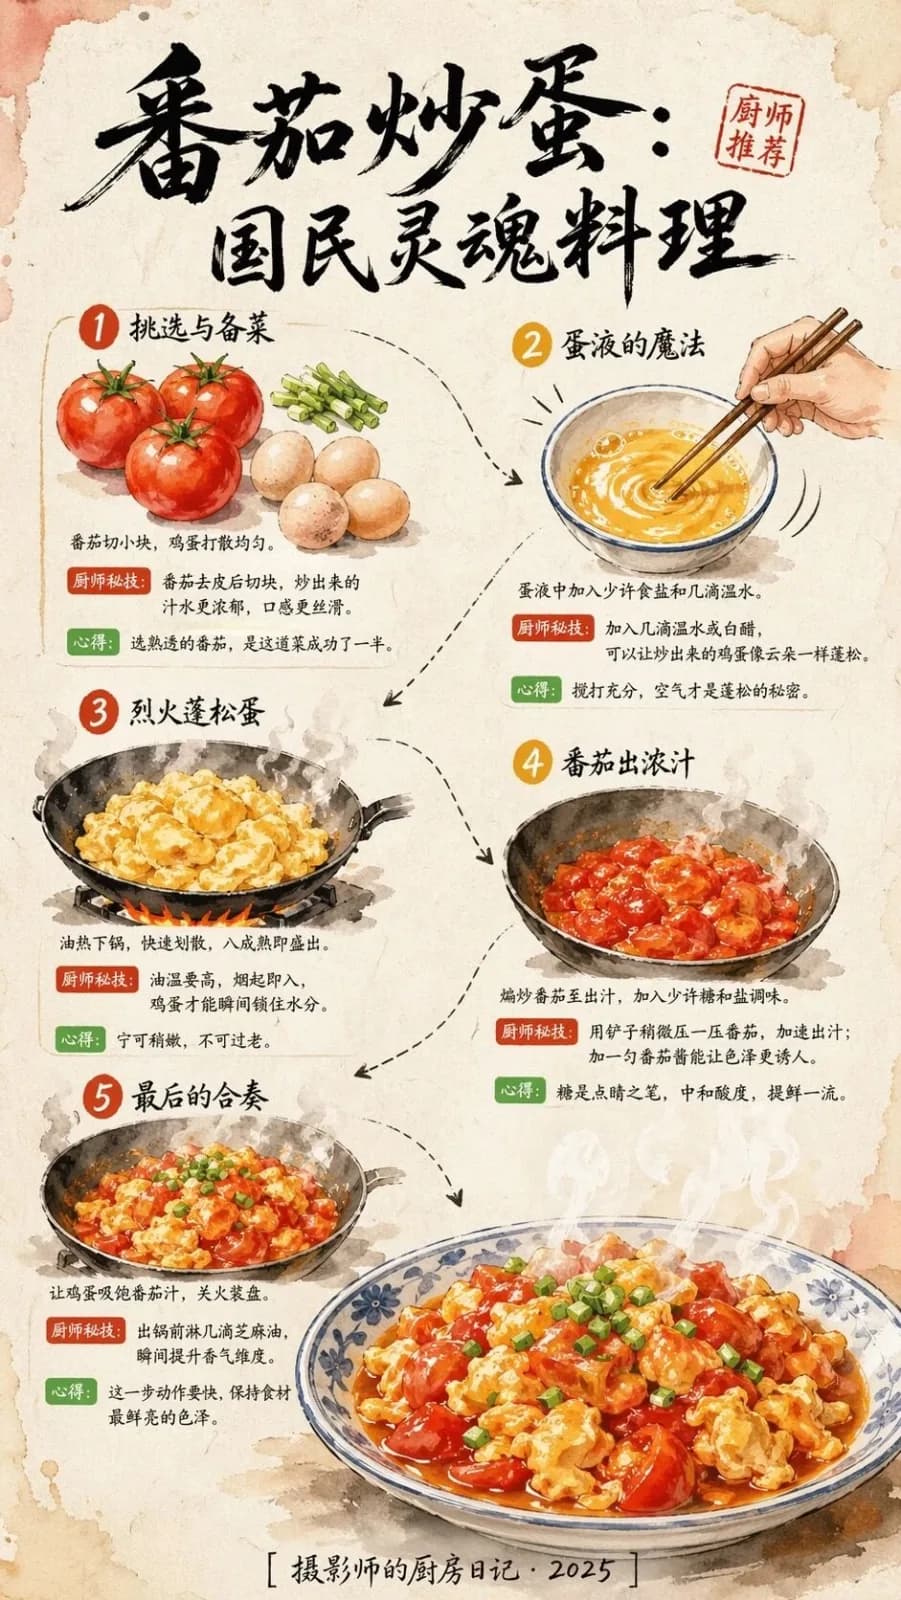
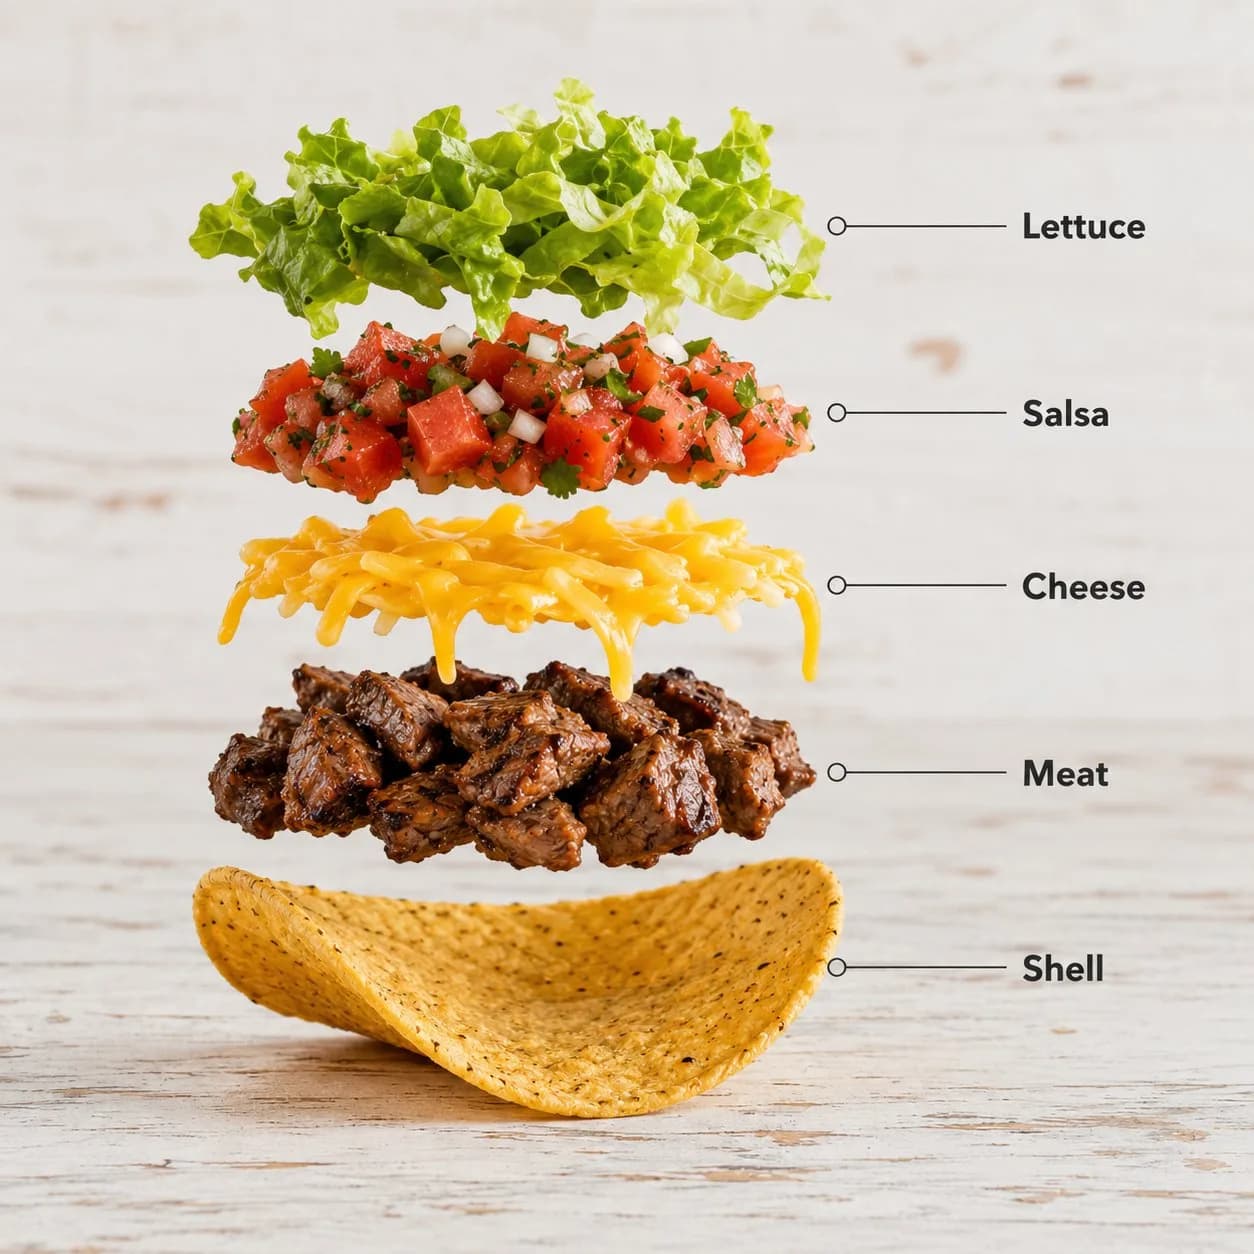
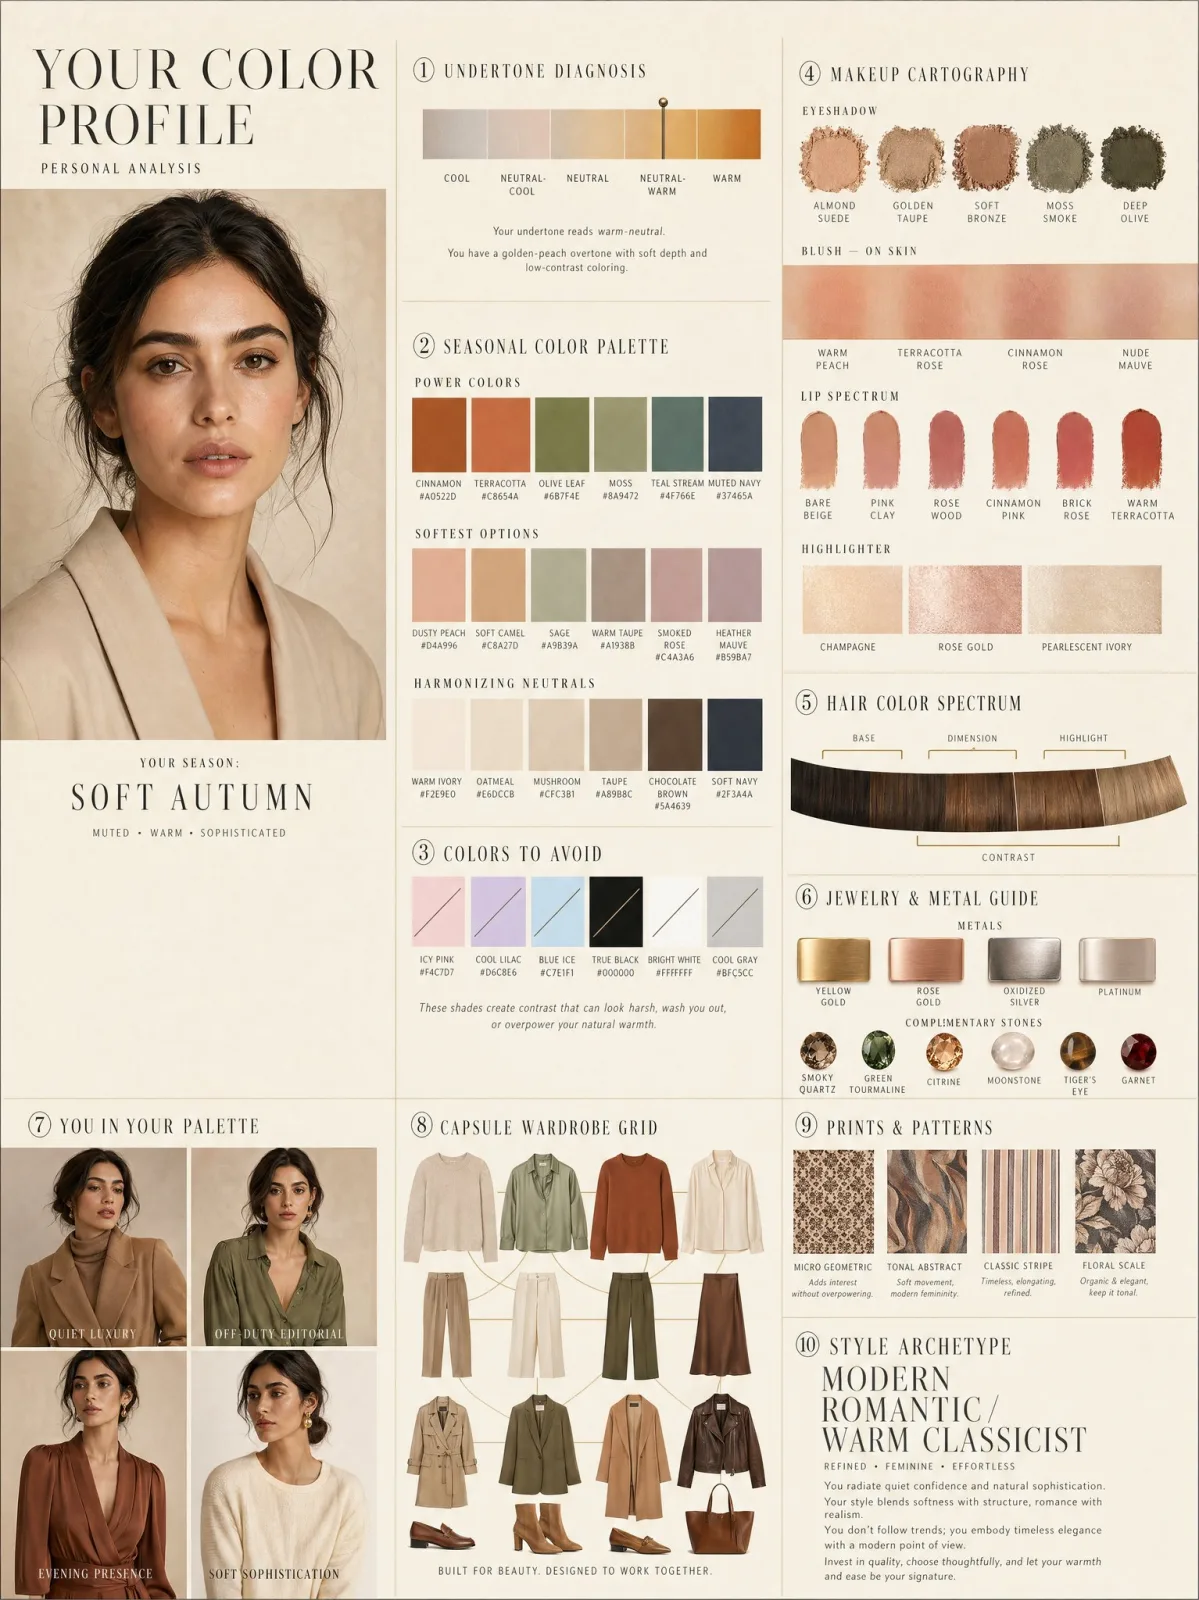
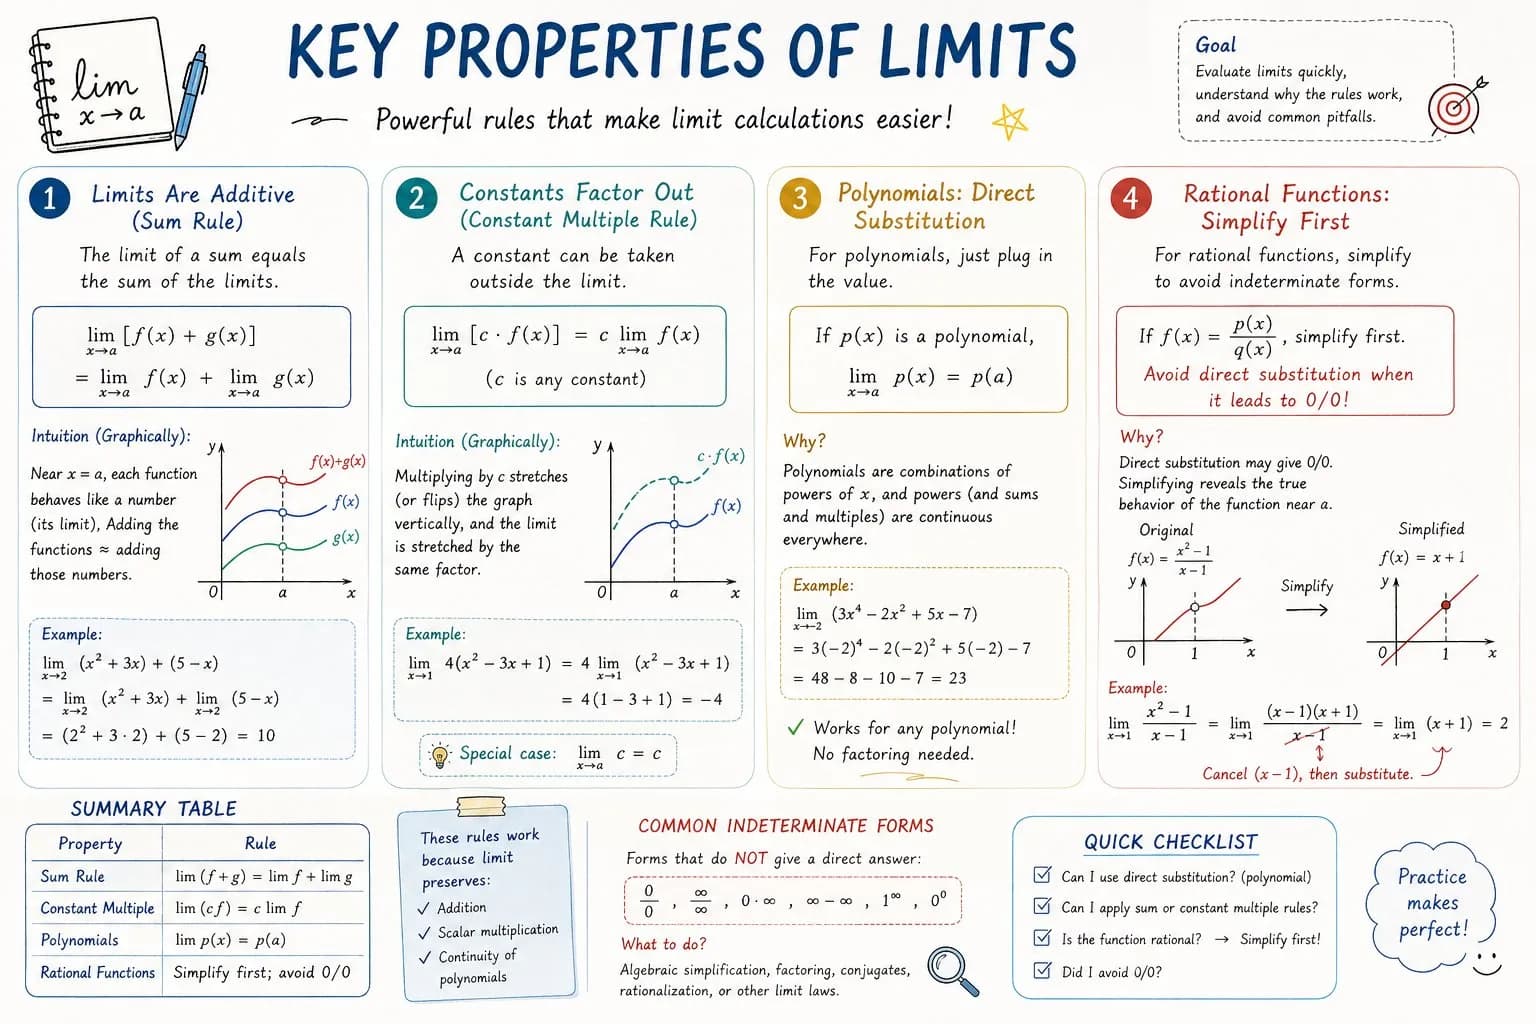
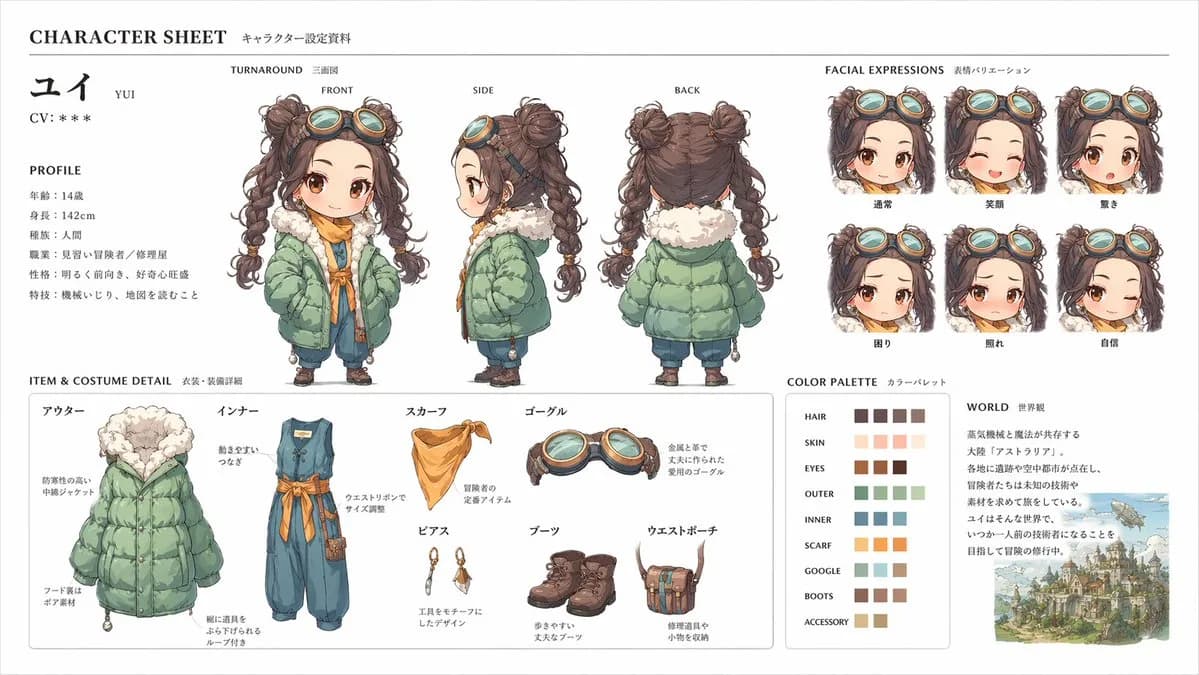

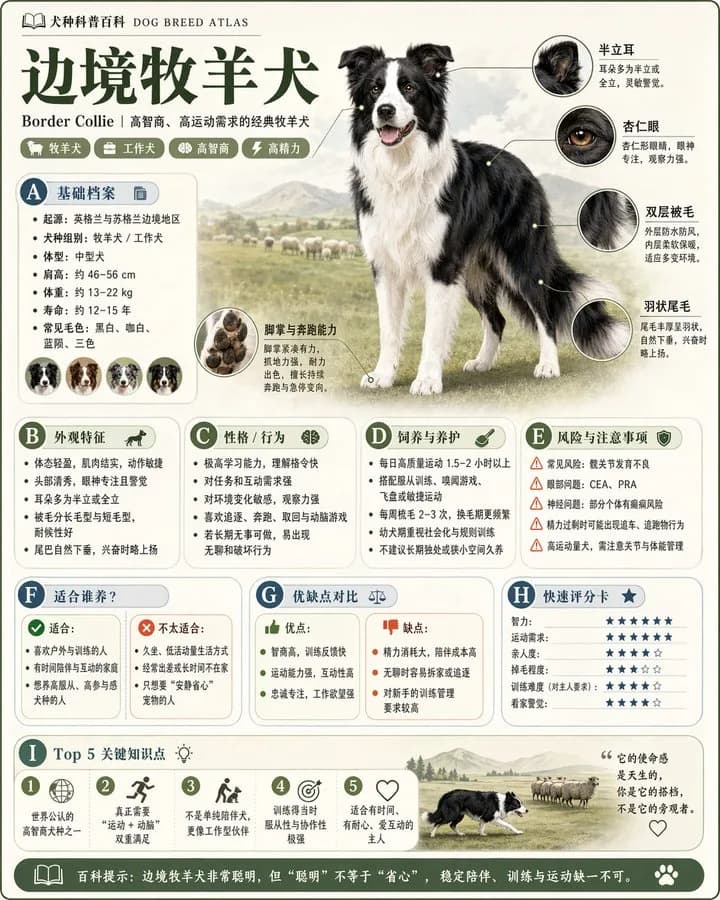



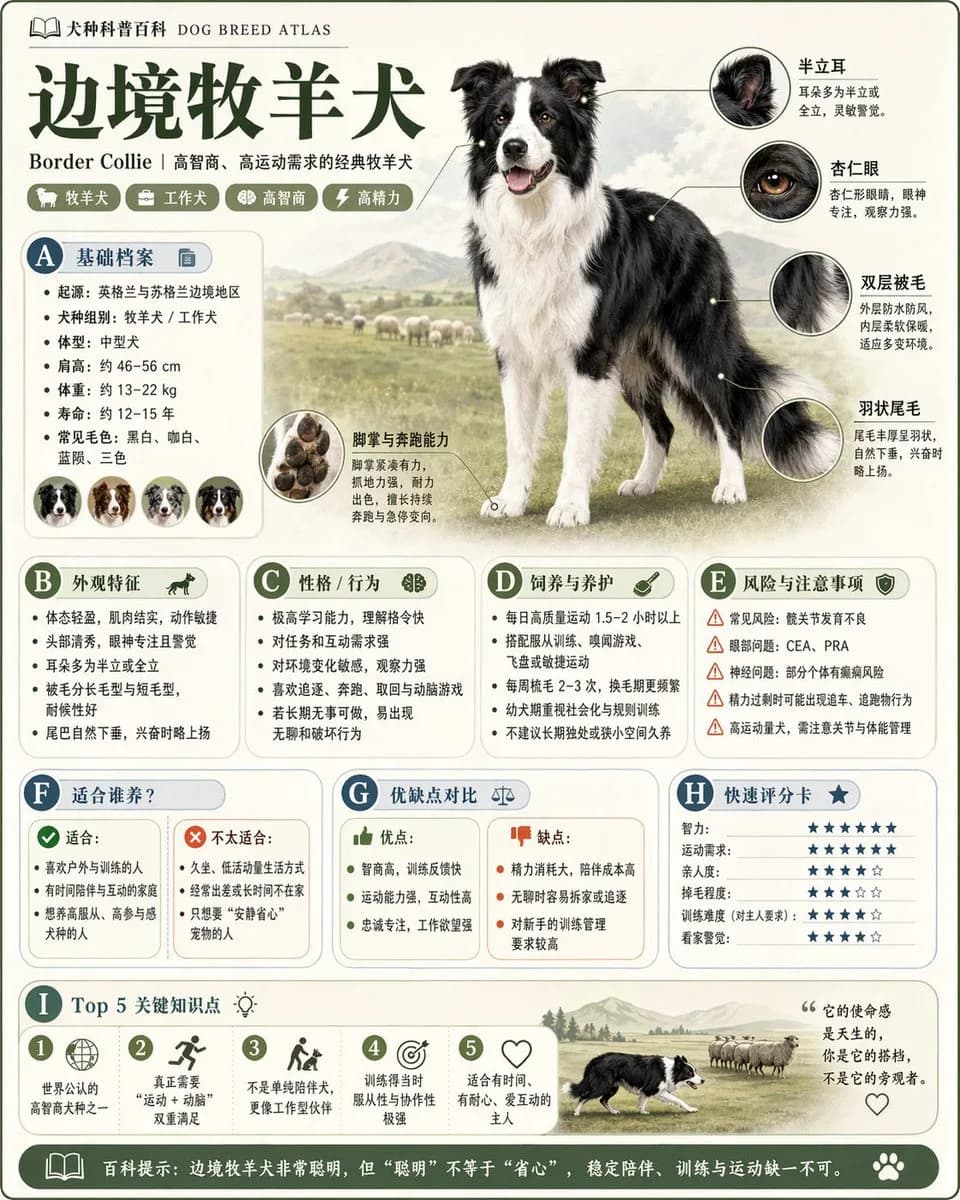

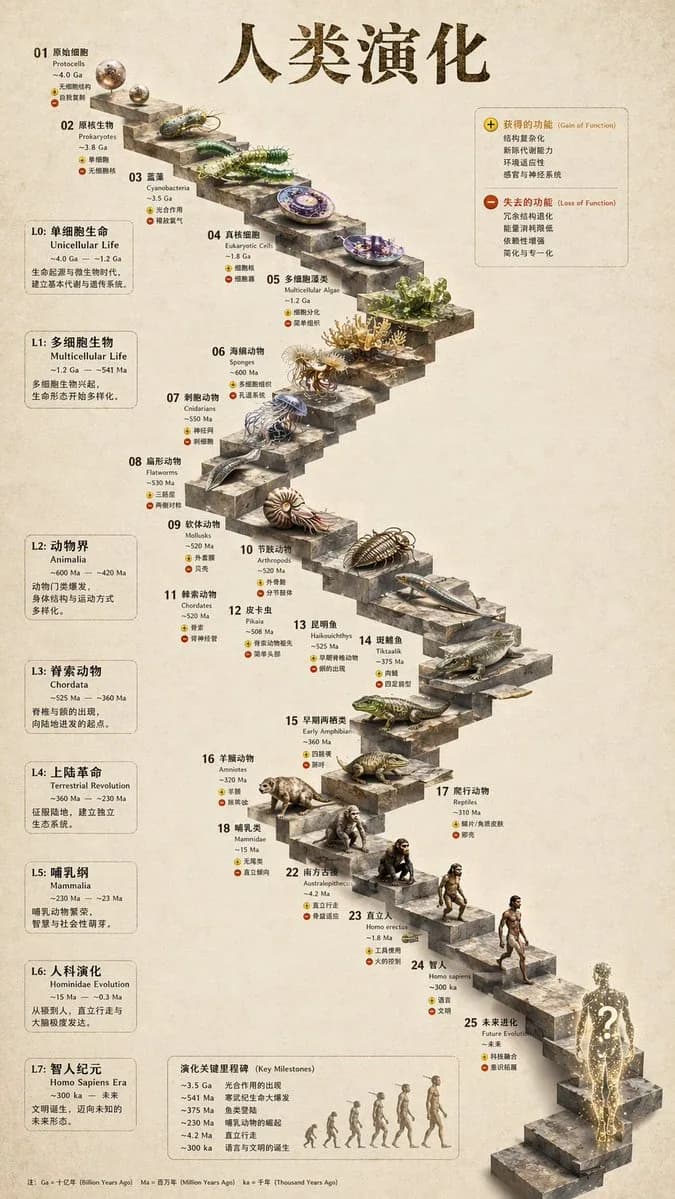
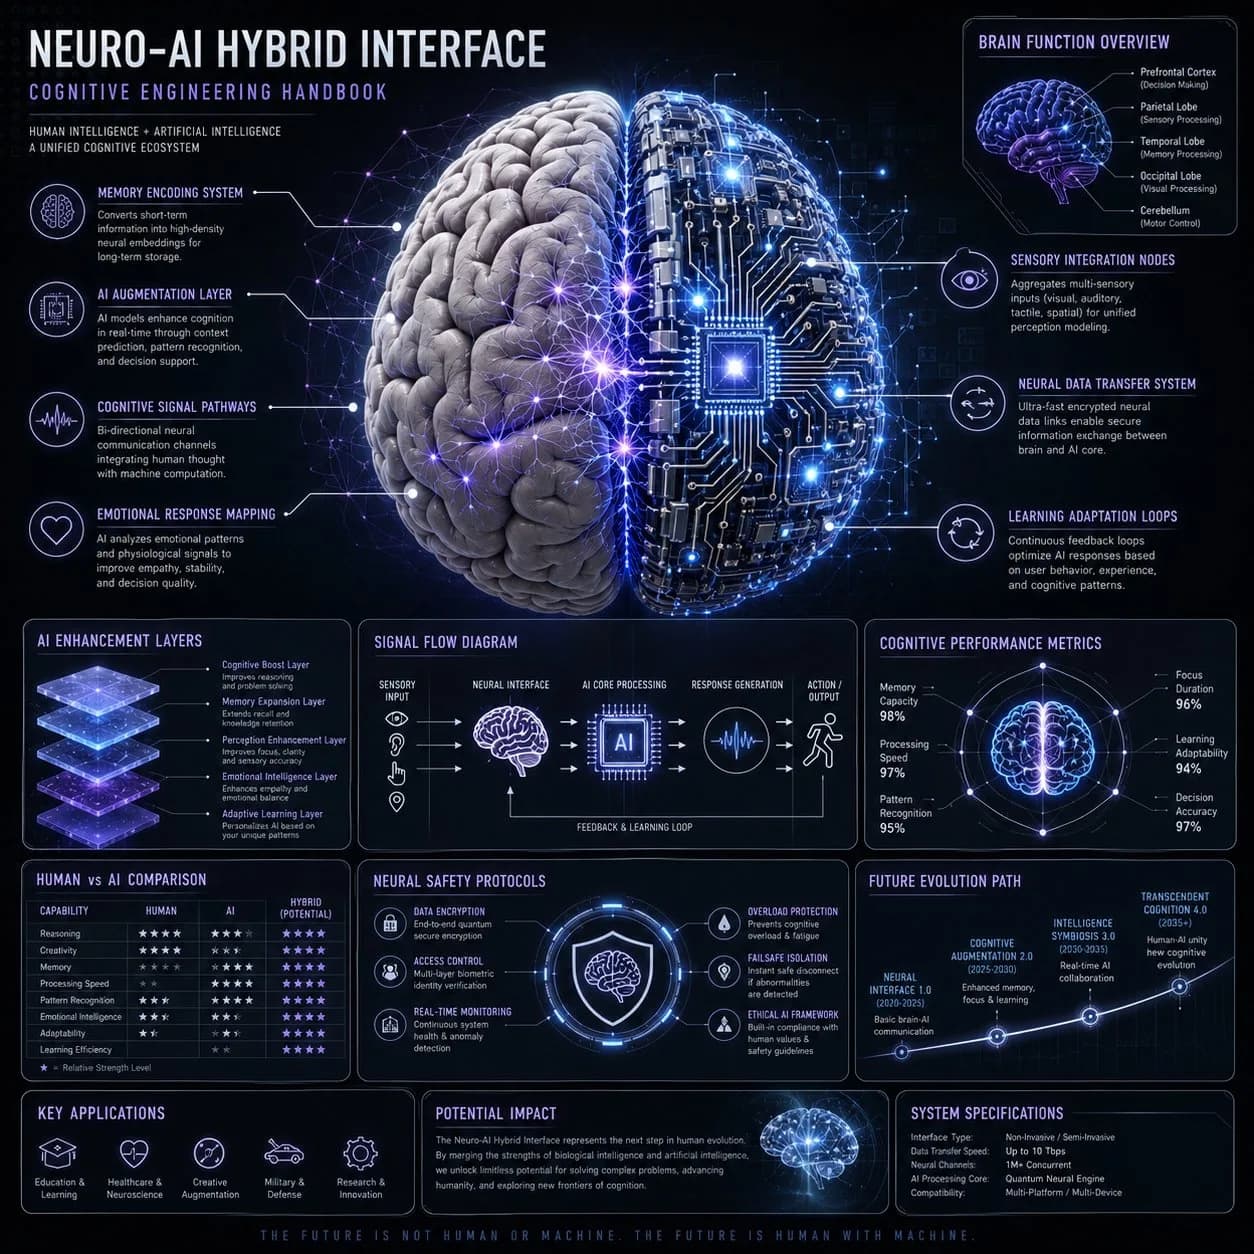
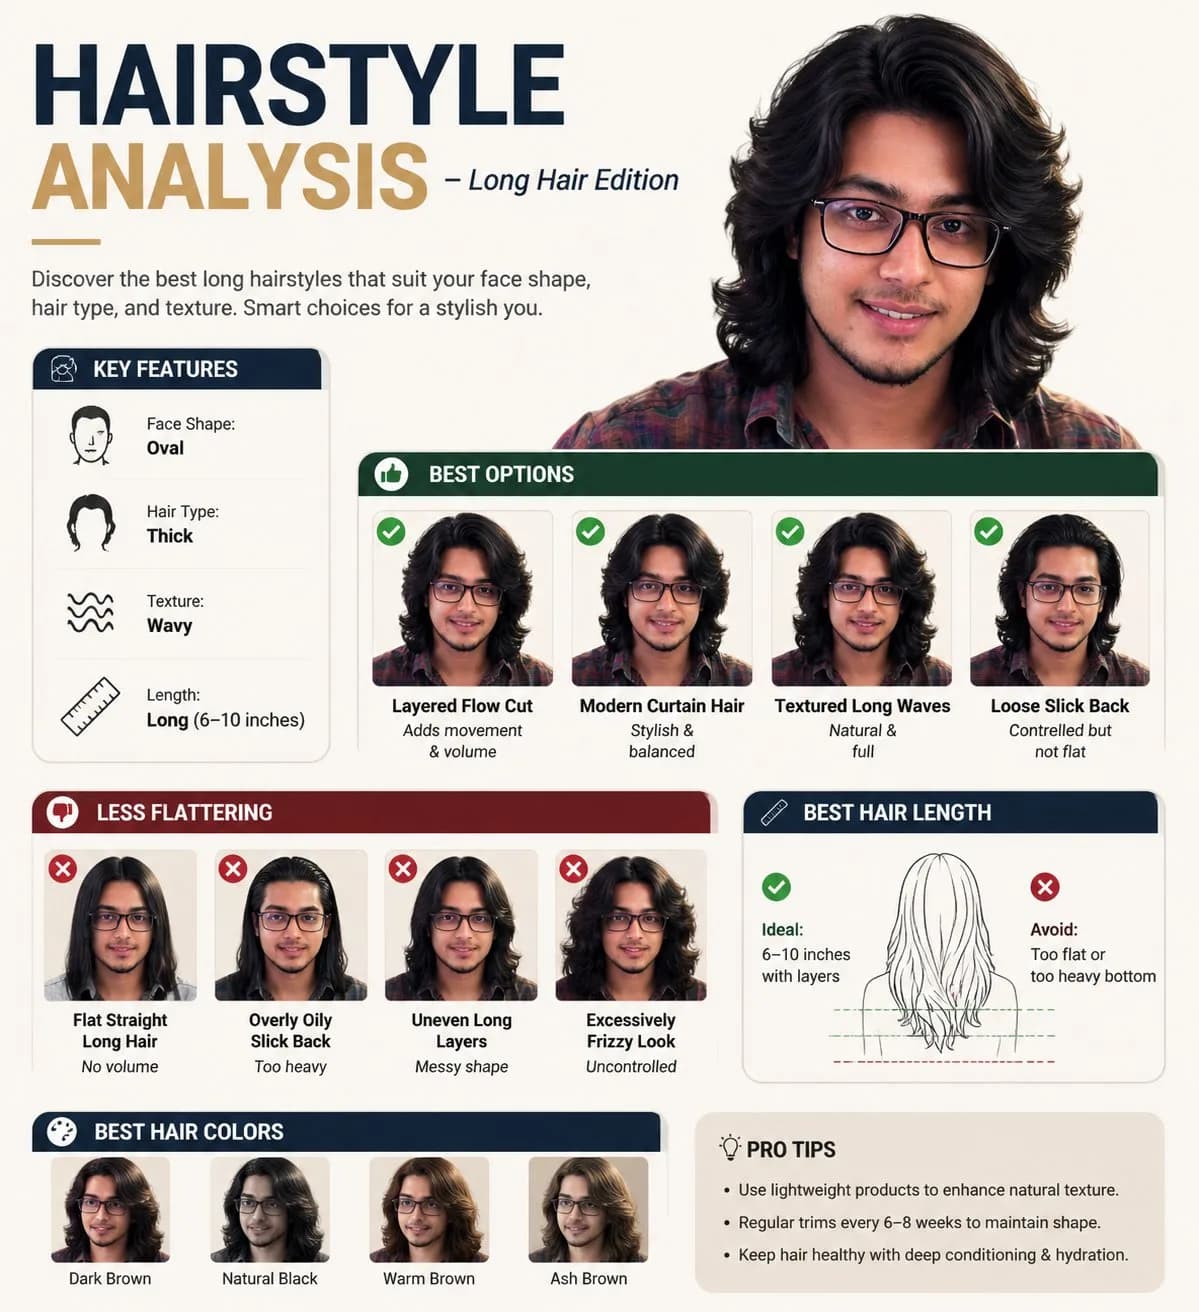
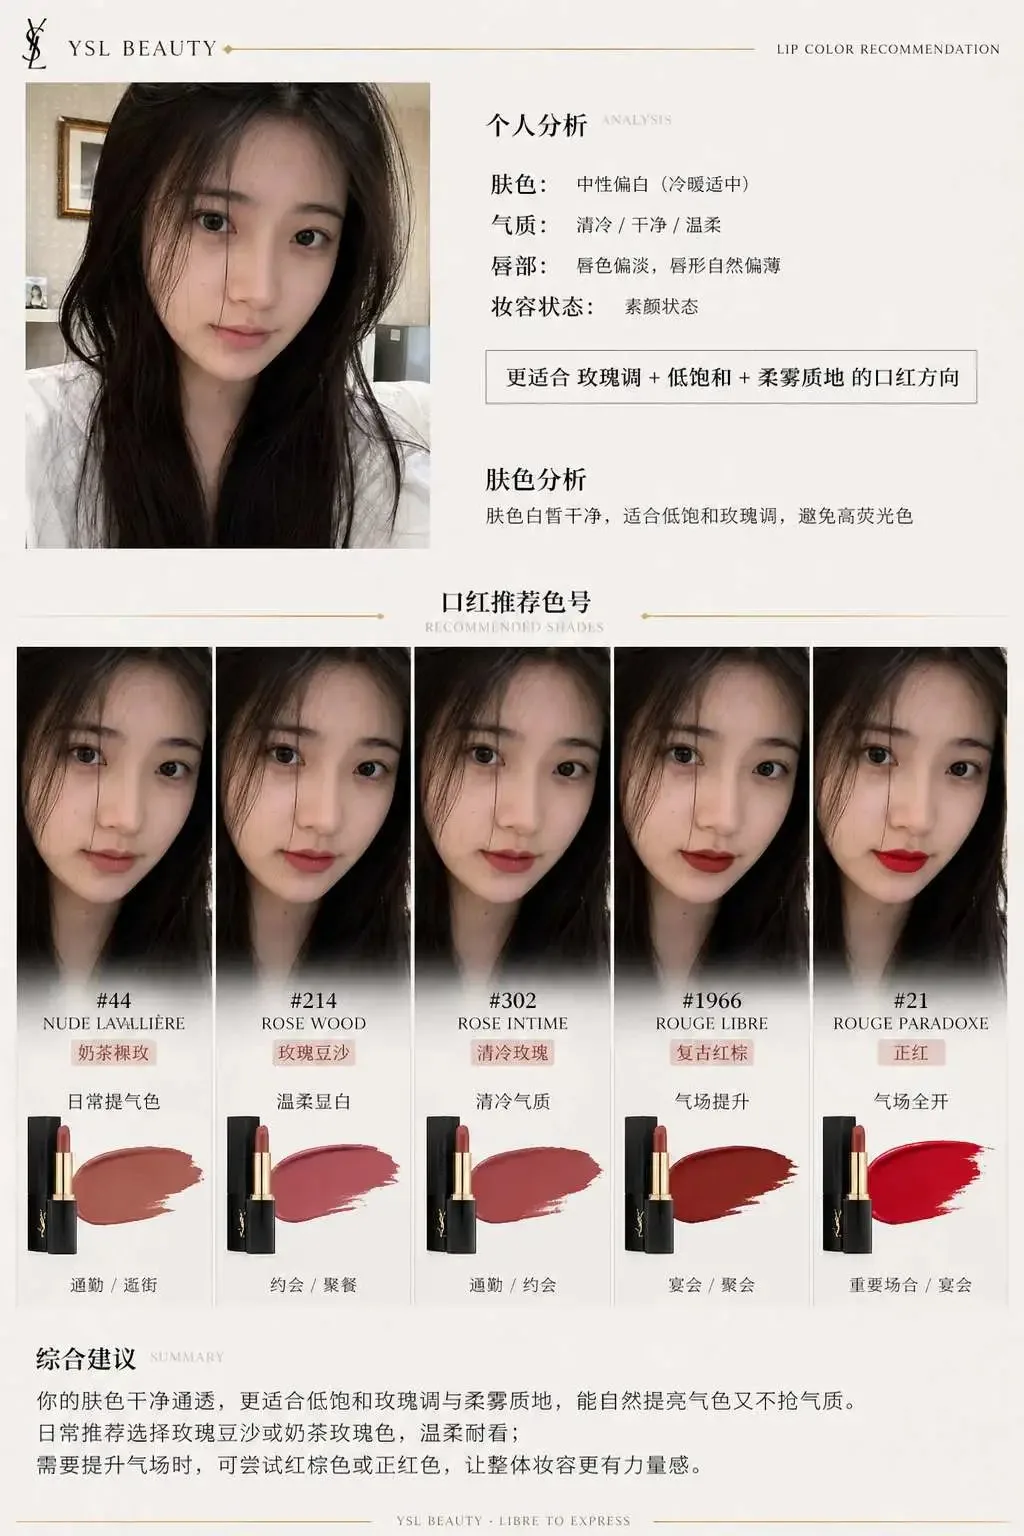

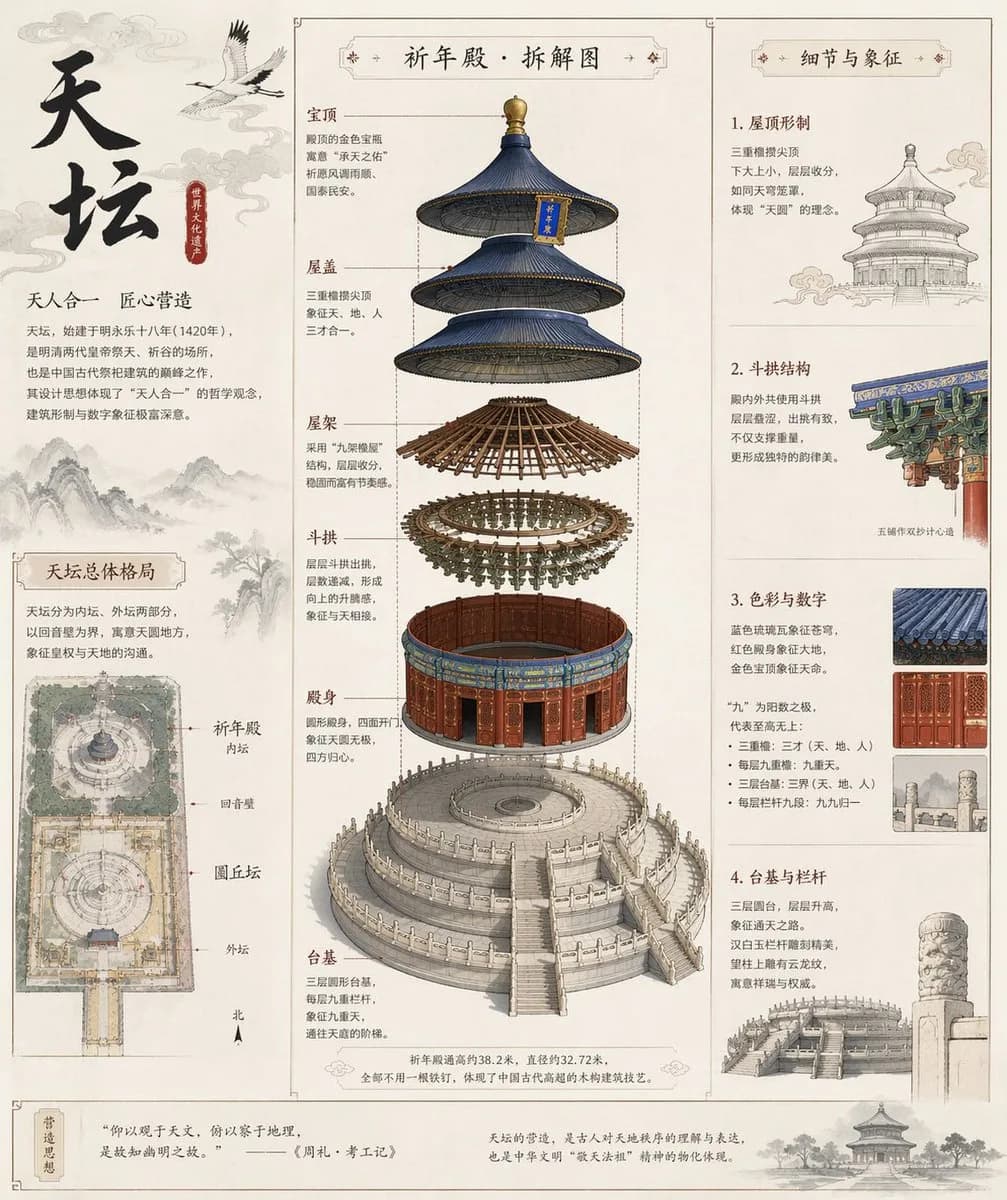
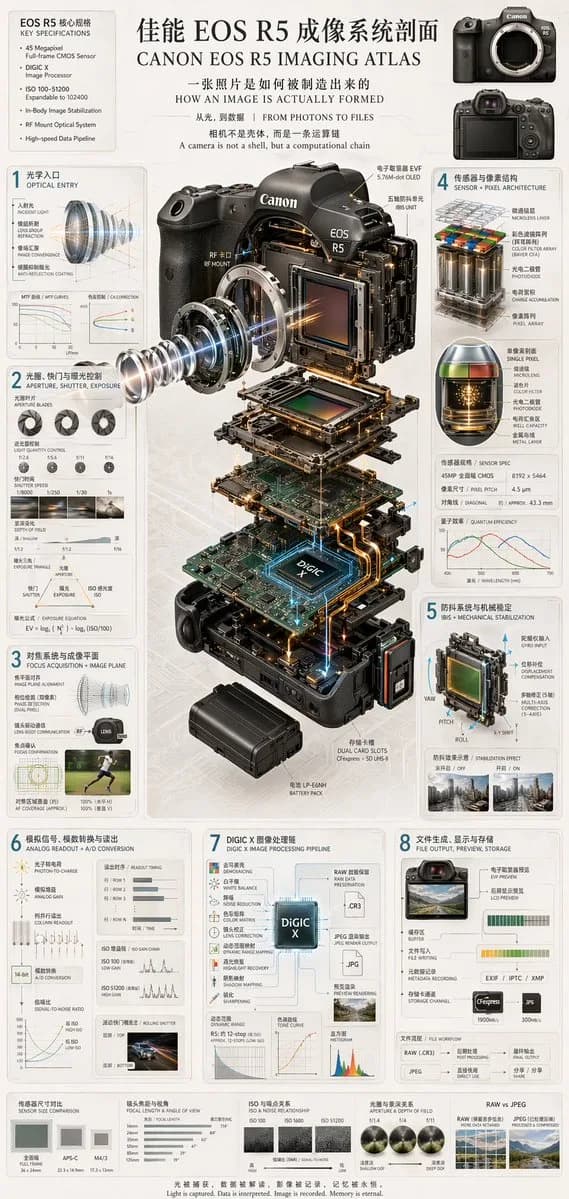
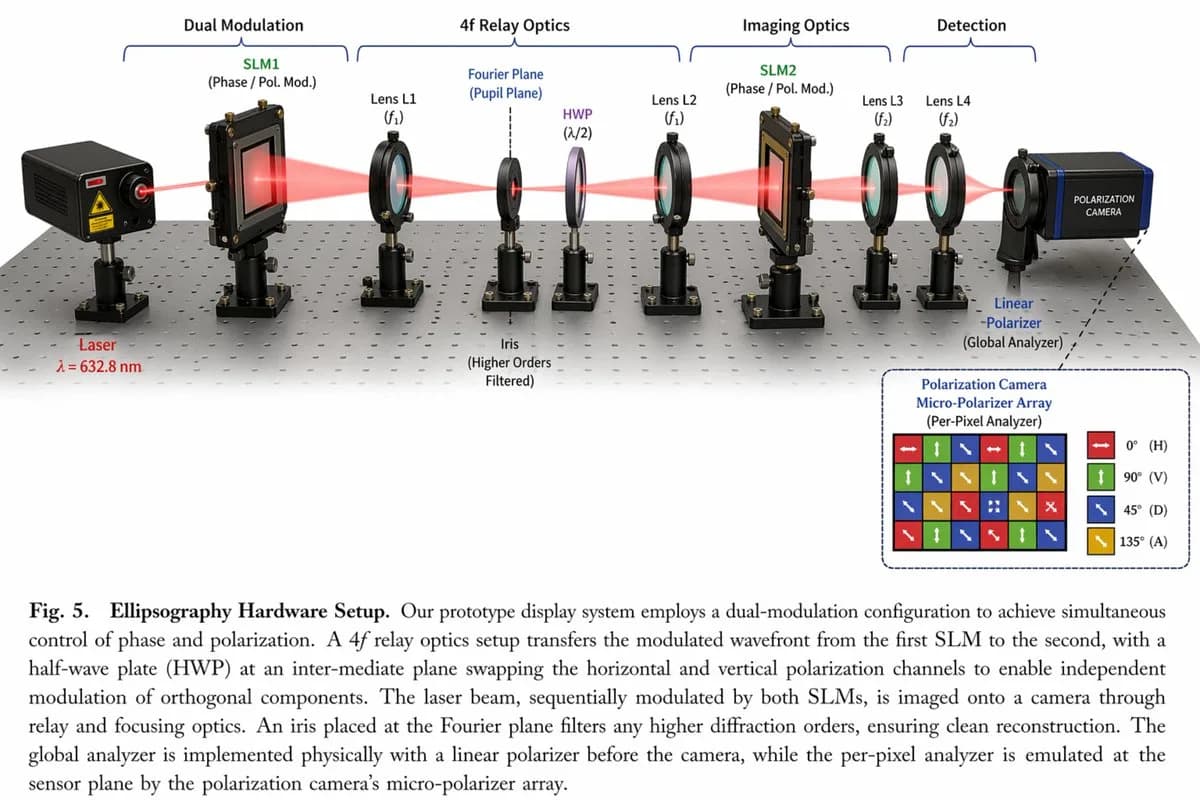

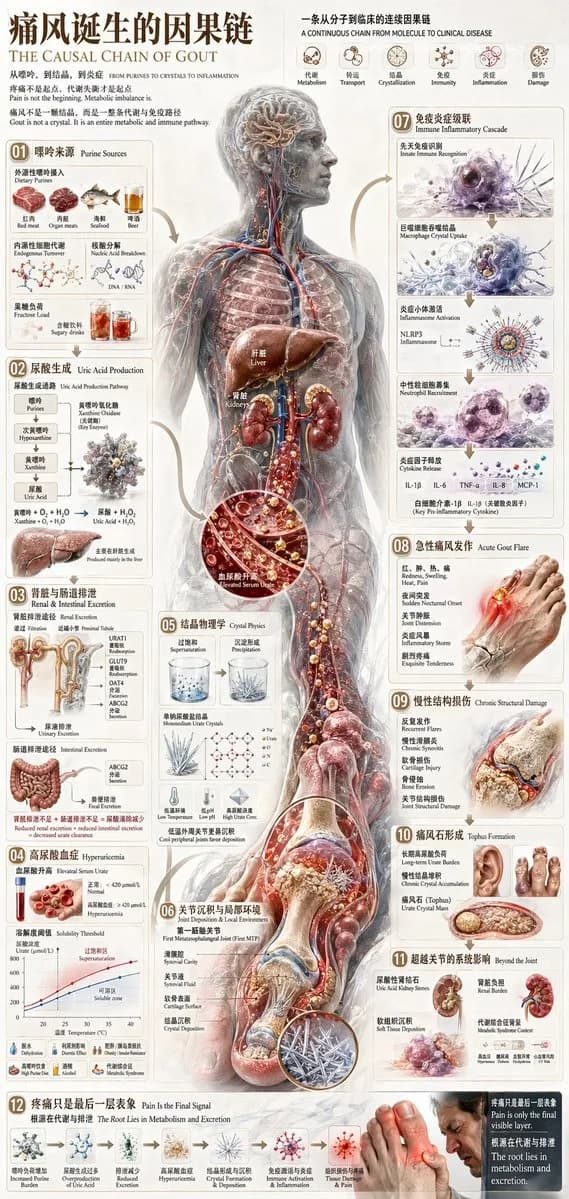
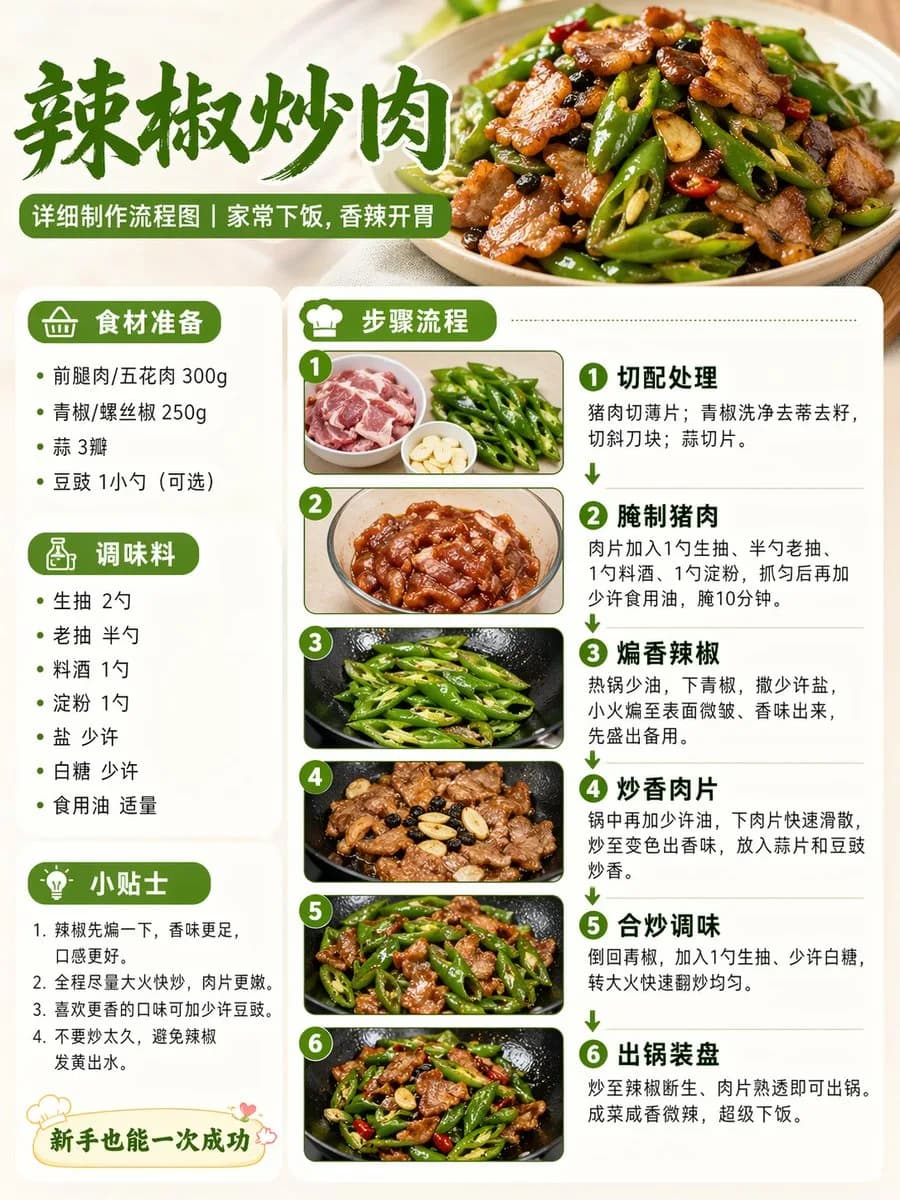
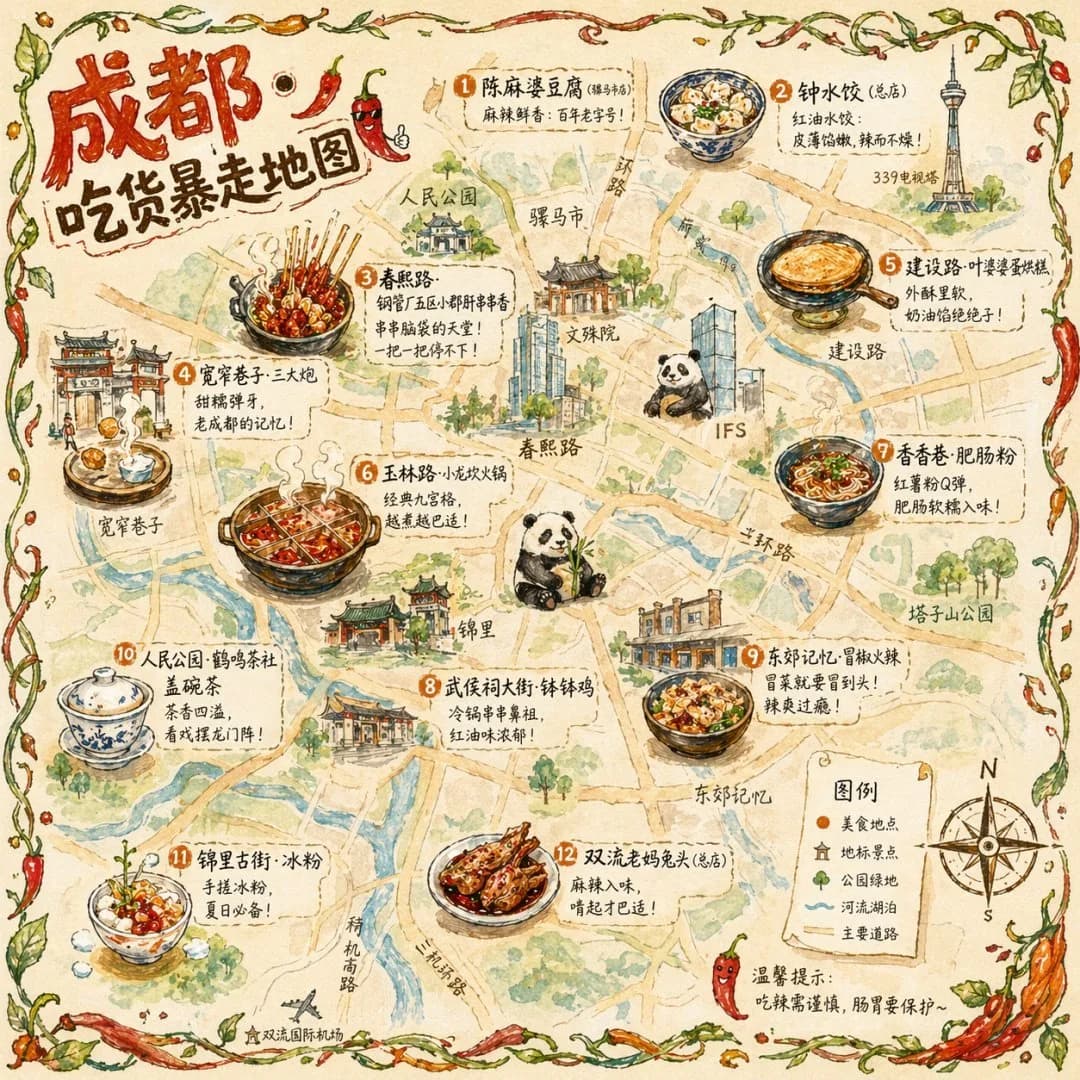
Isometric Exploded Technical Diagram Blueprint
Use this reusable prompt architecture as your base template. Swap the bracketed tokens with your specific subjects, lighting colors, and scene details.
Frequently asked questions
Common questions about generating, tuning, and prompting infographic design photos.
Can AI generate readable text inside infographics?
AI image models can generate short labels, but longer paragraphs often have artifacts. The best workflow is generating the diagrammatic artwork and callout lines, then adding final text in Figma or Canva.
What perspective works best for complex system diagrams?
Isometric 3D perspective works best because it shows top, front, and side surfaces simultaneously without extreme perspective distortion, making component relationships easy to follow.
How do I make technical diagrams look modern rather than outdated?
Prompt for matte clay materials, translucent frosted glass overlays, and a restrained color palette (e.g. monochrome with a single cyan or amber accent).
What prompt keywords produce clean cutaway views?
Use phrases like 'cross-section cutaway diagram', 'exploded assembly view', 'ghosted transparent outer shell showing internal mechanism', and 'architectural section drawing'.
Related creative resources
Explore neighboring studio hubs, prompt categories, and creative workflows.